The NVIDIA GeForce GTX 1080 & GTX 1070 Founders Editions Review: Kicking Off the FinFET Generation
by Ryan Smith on July 20, 2016 8:45 AM ESTSynthetics
Though we’ve covered bits and pieces of synthetic performance when discussing aspects of the Pascal architecture, before we move on to power testing I want to take a deeper look at synthetic performance. Based on what we know about the Pascal architecture we should have a good idea of what to expect, but these tests none the less serve as a canary for any architectural changes we may have missed.
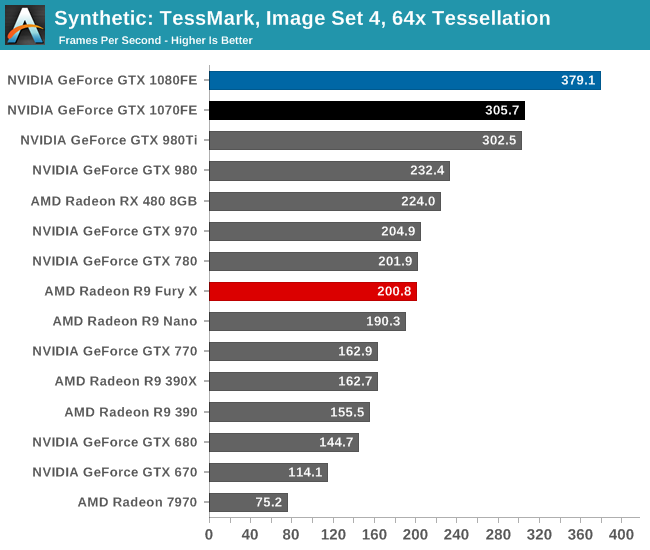
Starting off with tessellation performance, we find that the GTX 1080 further builds on NVIDIA’s already impressive tessellation performance. Unrivaled at this point, GTX 1080 delivers a 63% increase in tessellation performance here, and maintains a 24% lead over GTX 1070. Suffice it to say, the Pascal cards will have no trouble keeping up with geometry needs in games for a long time to come.
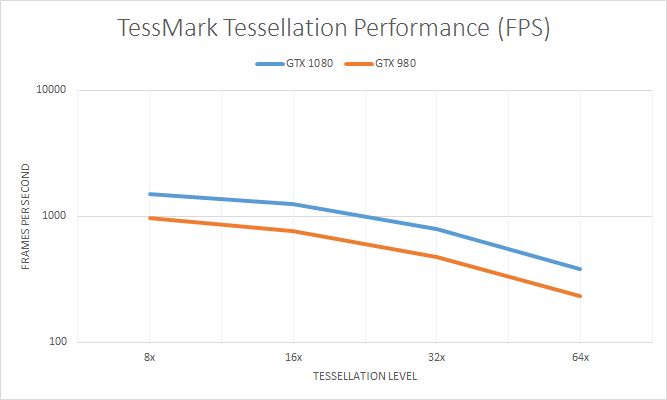
Breaking down performance by tessellation level to look at the GTX 980 and GTX 1080 more closely on a logarithmic scale, what we find is that there’s a rather consistent advantage for the GTX 1080 at all tessellation levels. Even 8x tessellation is still 56% faster. This indicates that NVIDIA hasn’t made any fundamental changes to their geometry hardware (PolyMorph Engines) between Maxwell 2 and Pascal. Everything has simply been scaled up in clockspeed and scaled out in the total number of engines. Though I will note that the performance gains are less than the theoretical maximum, so we're not seeing perfect scaling by any means.
Up next, we have SteamVR’s Performance Test. While this test is based on the latest version of Valve’s Source engine, the test itself is purely synthetic, designed to test the suitability of systems for VR, making it our sole VR-focused test at this time. It should be noted that the results in this test are not linear, and furthermore the score is capped at 11. Of particular note, cards that fail to reach GTX 970/R9 290 levels fall off of a cliff rather quickly. So test results should be interpreted a little differently.
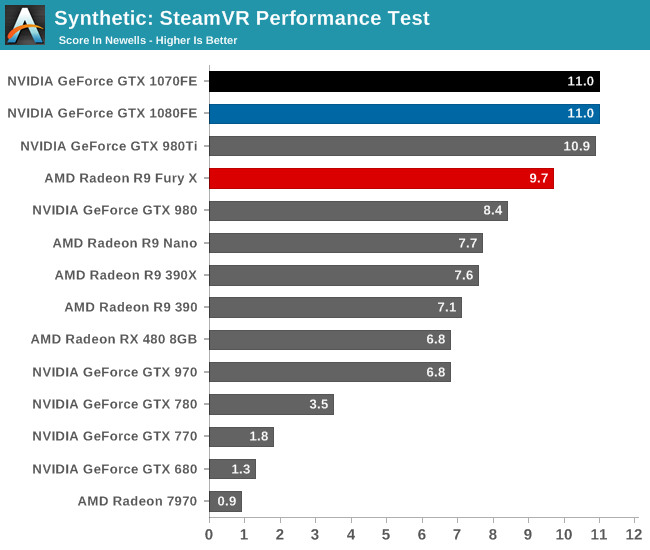
With the minimum recommended GTX 970 and Radeon R9 290 cards get in the mid-to-high 6 range, NVIDIA’s new Pascal cards max out the score at 11. Which for the purposes of this test means that both cards exceed Valve’s recommended specifications, making them capable of running Valve’s VR software at maximum quality with no performance issues.
Finally, for looking at texel and pixel fillrate, for 2016 we have switched from the rather old 3DMark Vantage to the Beyond3D Test Suite. This test offers a slew of additional tests – many of which use behind the scenes or in our earlier architectural analysis – but for now we’ll stick to simple pixel and texel fillrates.
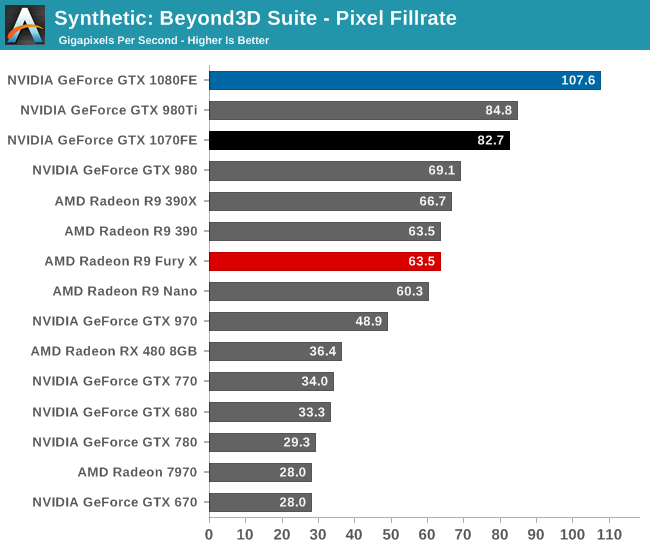
Starting with pixel fillrate, the GTX 1080 is well in the lead. While at 64 ROPs GP104 has fewer ROPs than the GM200 based GTX 980 Ti, it more than makes up for the difference with significantly higher clockspeeds. Similarly, when it comes to feeding those ROPs, GP104’s narrower memory bus is more than offset with the use of 10Gbps GDDR5X. But even then the two should be closer than this on paper, so the GTX 1080 is exceeding expectations.
As we discovered in 2014 with Maxwell 2, NVIDIA’s Delta Color Compression technology has a huge impact on pixel fillrate testing. So most likely what we’re seeing here is Pascal’s 4th generation DCC in action, helping GTX 1080 further compress its buffers and squeeze more performance out of the ROPs.
Though with that in mind, it’s interesting to note that even with an additional generation of DCC, this really only helps NVIDIA keep pace. The actual performance gains here versus GTX 980 are 56%, not too far removed from the gains we see in games and well below the theoretical difference in FLOPs. So despite the increase in pixel throughput due to architectural efficiency, it’s really only enough to help keep up with the other areas of the more powerful Pascal GPU.
As for GTX 1070, things are a bit different. The card has all of the ROPs of GTX 1080 and 80% of the memory bandwidth, however what it doesn’t have is GP104’s 4th GPC. Home of the Raster Engine responsible for rasterization, GTX 1070 can only setup 48 pixels/clock to begin with, despite the fact that the ROPs can accept 64 pixels. As a result it takes a significant hit here, delivering 77% of GTX 1080’s pixel throughput. With all of that said, the fact that in-game performance is closer than this is a reminder to the fact that while pixel throughput is an important part of game performance, it’s often not the bottleneck.
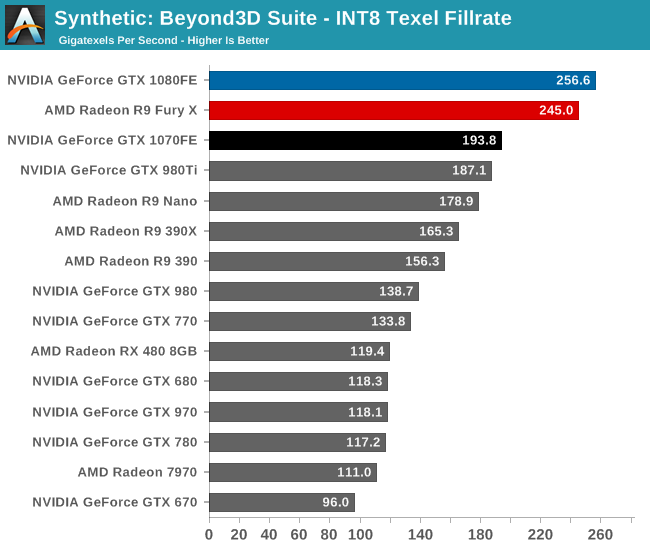
As for INT8 texel fillrates, the results are much more straightforward. GTX 1080’s improvement over GTX 980 in texel throughput almost perfectly matches the theoretical improvement we’d expect based on the specifications (if not slightly exceeding it), delivering an 85% boost. As a result it’s now the top card in our charts for texel throughput, dethroning the still-potent Fury X. Meanwhile GTX 1070 backs off a bit from these gains, as we’d expect, as a consequence of having only three-quarters the number of texture units.


200 Comments
View All Comments
Ranger1065 - Thursday, July 21, 2016 - link
Your unwavering support for Anandtech is impressive.I too have a job that keeps me busy, yet oddly enough I find the time to browse (I prefer that word to "trawl") a number of sites.
I find it helps to form objective opinions.
I don't believe in early adoption, but I do believe in getting the job done on time, however if you are comfortable with a 2 month delay, so be it :)
Interesting to note that architectural deep dives concern your art and media departments so closely in their purchasing decisions. Who would have guessed?
It's true (God knows it's been stated here often enough) that
Anandtech goes into detail like no other, I don't dispute that.
But is it worth the wait? A significant number seem to think not.
Allow me to leave one last issue for you to ponder (assuming you have the time in your extremely busy schedule).
Is it good for Anandtech?
catavalon21 - Thursday, July 21, 2016 - link
Impatient as I was at the first for benchmarks, yes, I'm a numbers junkie, since it's evident precious few of us will have had a chance to buy one of these cards yet (or the 480), I doubt the delay has caused anyone to buy the wrong card. Can't speak for the smart phone review folks are complaining about being absent, but as it turns out, what I'm initially looking for is usually done early on in Bench. The rest of this, yeah, it can wait.mkaibear - Saturday, July 23, 2016 - link
Job, house, kids, church... more than enough to keep me sufficiently busy that I don't have the time to browse more than a few sites. I pick them quite carefully.Given the lifespan of a typical system is >5 years I think that a 2 month delay is perfectly reasonable. It can often take that long to get purchasing signoff once I've decided what they need to purchase anyway (one of the many reasons that architectural deep dives are useful - so I can explain why the purchase is worthwhile). Do you actually spend someone else's money at any point or are you just having to justify it to yourself?
Whether or not it's worth the wait to you is one thing - but it's clearly worth the wait to both Anandtech and to Purch.
razvan.uruc@gmail.com - Thursday, July 21, 2016 - link
Excellent article, well deserved the wait!giggs - Thursday, July 21, 2016 - link
While this is a very thorough and well written review, it makes me wonder about sponsored content and product placement.The PG279Q is the only monitor mentionned, making sure the brand appears, and nothing about competing products. It felt unnecessary.
I hope it's just a coincidence, but considering there has been quite a lot of coverage about Asus in the last few months, I'm starting to doubt some of the stuff I read here.
Ryan Smith - Thursday, July 21, 2016 - link
"The PG279Q is the only monitor mentionned, making sure the brand appears, and nothing about competing products."There's no product placement or the like (and if there was, it would be disclosed). I just wanted to name a popular 1440p G-Sync monitor to give some real-world connection to the results. We've had cards for a bit that can drive 1440p monitors at around 60fps, but GTX 1080 is really the first card that is going to make good use of higher refresh rate monitors.
giggs - Thursday, July 21, 2016 - link
Fair enough, thank you for responding promptly. Keep up the good work!arh2o - Thursday, July 21, 2016 - link
This is really the gold standard of reviews. More in-depth than any site on the internet. Great job Ryan, keep up the good work.Ranger1065 - Thursday, July 21, 2016 - link
This is a quality article.timchen - Thursday, July 21, 2016 - link
Great article. It is pleasant to read more about technology instead of testing results. Some questions though:1. higher frequency: I am kind of skeptical that the overall higher frequency is mostly enabled by FinFET. Maybe it is the case, but for example when Intel moved to FinFET we did not see such improvement. RX480 is not showing that either. It seems pretty evident the situation is different from 8800GTX where we first get frequency doubling/tripling only in the shader domain though. (Wow DX10 is 10 years ago... and computation throughput is improved by 20x)
2. The fastsync comparison graph looks pretty suspicious. How can Vsync have such high latency? The most latency I can see in a double buffer scenario with vsync is that the screen refresh just happens a tiny bit earlier than the completion of a buffer. That will give a delay of two frame time which is like 33 ms (Remember we are talking about a case where GPU fps>60). This is unless, of course, if they are testing vsync at 20hz or something.