The NVIDIA GeForce GTX 1080 & GTX 1070 Founders Editions Review: Kicking Off the FinFET Generation
by Ryan Smith on July 20, 2016 8:45 AM ESTOverclocking
For our final evaluation of the GTX 1080 and GTX 1070 Founders Edition cards, let’s take a look a overclocking.
Whenever I review an NVIDIA reference card, I feel it’s important to point out that while NVIDIA supports overclocking – why else would they include fine-grained controls like GPU Boost 3.0 – they have taken a hard stance against true overvolting. Overvolting is limited to NVIDIA’s built in overvoltage function, which isn’t so much a voltage control as it is the ability to unlock 1-2 more boost bins and their associated voltages. Meanwhile TDP controls are limited to whatever value NVIDIA believes is safe for that model card, which can vary depending on its GPU and its power delivery design.
For GTX 1080FE and its 5+1 power design, we have a 120% TDP limit, which translates to an absolute maximum TDP of 216W. As for GTX 1070FE and its 4+1 design, this is reduced to a 112% TDP limit, or 168W. Both cards can be “overvolted” to 1.093v, which represents 1 boost bin. As such the maximum clockspeed with NVIDIA’s stock programming is 1911MHz.
| GeForce GTX 1080FE Overclocking | ||||
| Stock | Overclocked | |||
| Core Clock | 1607MHz | 1807MHz | ||
| Boost Clock | 1734MHz | 1934MHz | ||
| Max Boost Clock | 1898MHz | 2088MHz | ||
| Memory Clock | 10Gbps | 11Gbps | ||
| Max Voltage | 1.062v | 1.093v | ||
| GeForce GTX 1070FE Overclocking | ||||
| Stock | Overclocked | |||
| Core Clock | 1506MHz | 1681MHz | ||
| Boost Clock | 1683MHz | 1858MHz | ||
| Max Boost Clock | 1898MHz | 2062MHz | ||
| Memory Clock | 8Gbps | 8.8Gbps | ||
| Max Voltage | 1.062v | 1.093v | ||
Both cards ended up overclocking by similar amounts. We were able to take the GTX 1080FE another 200MHz (+12% boost) on the GPU, and another 1Gbps (+10%) on the memory clock. The GTX 1070 could be pushed another 175MHz (+10% boost) on the GPU, while memory could go another 800Mbps (+10%) to 8.8Gbps.
Both of these are respectable overclocks, but compared to Maxwell 2 where our reference cards could do 20-25%, these aren’t nearly as extreme. Given NVIDIA’s comments on the 16nm FinFET voltage/frequency curve being steeper than 28nm, this could be first-hand evidence of that. It also indicates that NVIDIA has pushed GP104 closer to its limit, though that could easily be a consequence of the curve.
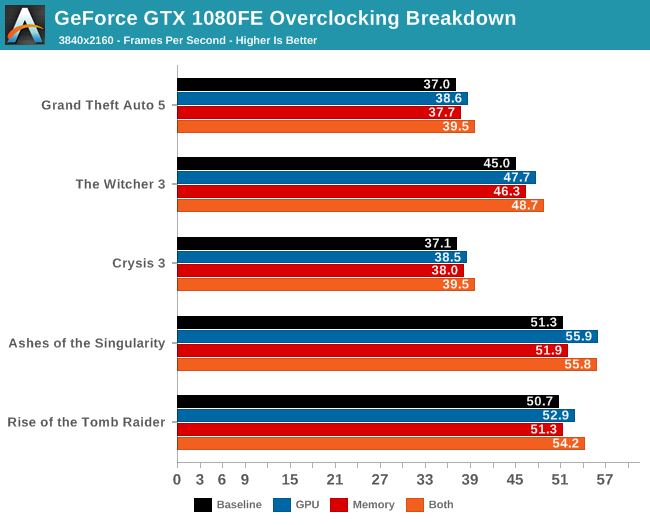
Given that this is our first look at Pascal, before diving into overall performance, let’s first take a look at an overclocking breakdown. NVIDIA offers 4 knobs to adjust when overclocking: overvolting (unlocking additional boost bins), increasing the power/temperature limits, the memory clock, and the GPU clock. Though all 4 will be adjusted for a final overclock, it’s often helpful to see whether it’s GPU overclocking or memory overclocking that delivers the greater impact, especially as it can highlight where the performance bottlenecks are on a card.
To examine this, we’ve gone ahead and benchmarked the GTX 1080 4 times: once with overvolting and increased power/temp limits (to serve as a baseline), once with the memory overclocked added, once with GPU overclock added, and finally with both the GPU and memory overclocks added.
| GeForce GTX 1080 Overclocking Performance | ||||||
| Power/Temp Limit (+20%) | Core (+12%) | Memory (+10%) | Cumulative | |||
| Tomb Raider |
+3%
|
+4%
|
+1%
|
+10%
|
||
| Ashes |
+1%
|
+9%
|
+1%
|
+10%
|
||
| Crysis 3 |
+4%
|
+4%
|
+2%
|
+11%
|
||
| The Witcher 3 |
+2%
|
+6%
|
+3%
|
+10%
|
||
| Grand Theft Auto V |
+1%
|
+4%
|
+2%
|
+8%
|
||
Across all 5 games, the results are clear and consistent: GPU overclocking contributes more to performance than memory overclocking. To be sure, both contribute, but even after compensating for the fact that the GPU overclock was a bit greater than the memory overclock (12% vs 10%), we still end up with the GPU more clearly contributing. Though I am a bit surprised that increasing the power/temperature limit didn't have more of an effect.
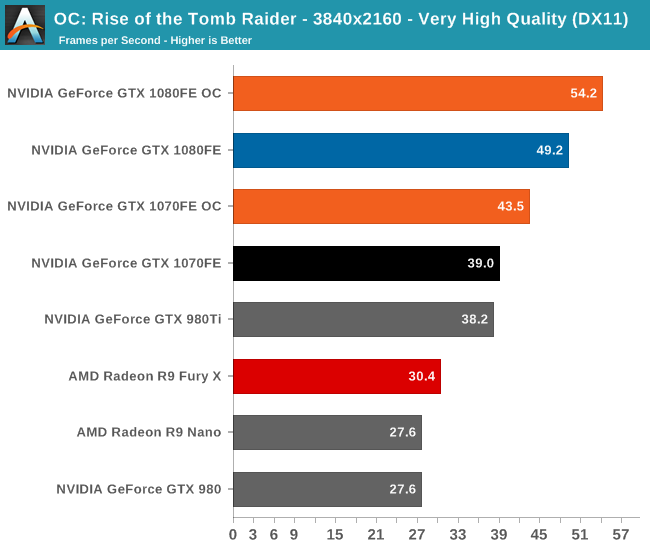
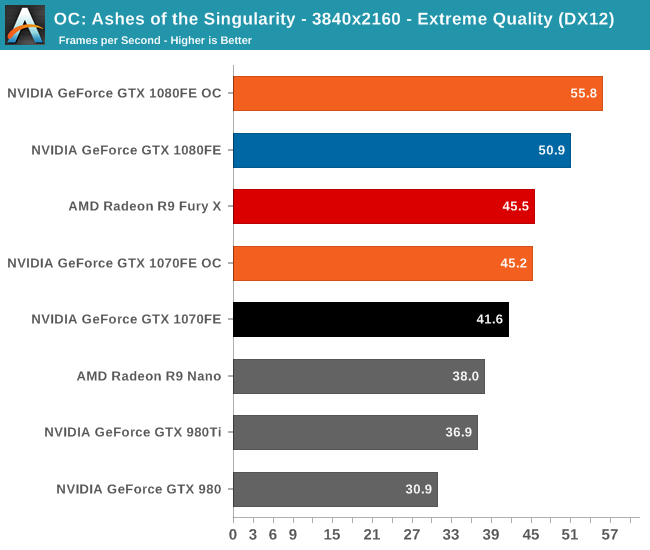
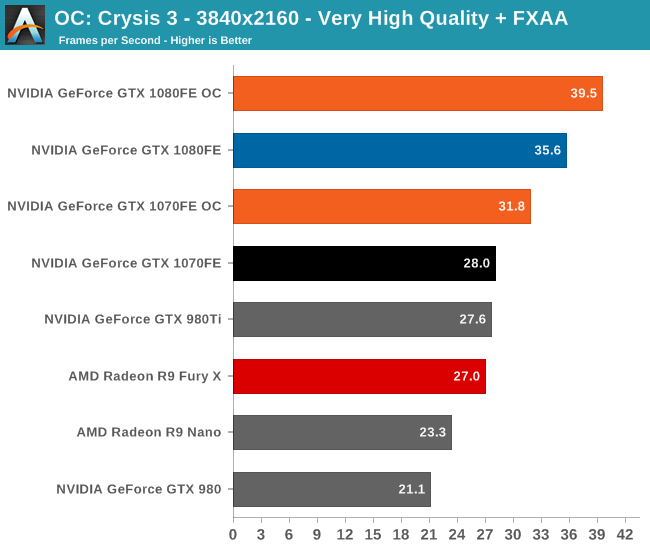

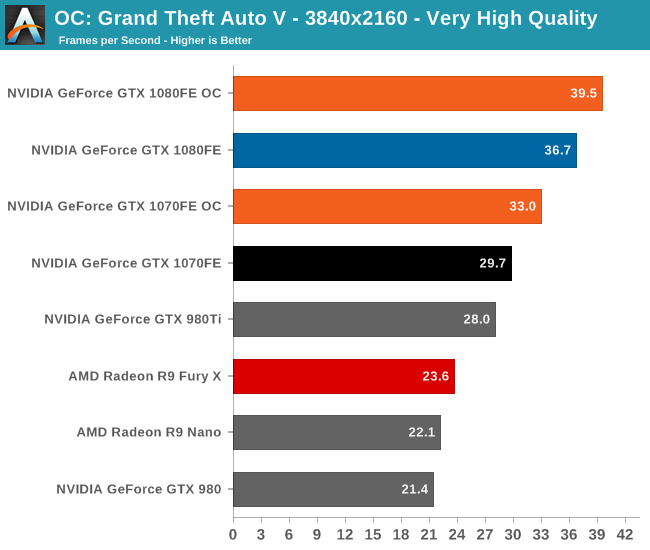
Overall we’re looking at an 8%-10% increase in performance from overclocking. It’s enough to further stretch the GTX 1080FE and GTX 1070FE’s leads, but it won’t radically alter performance.
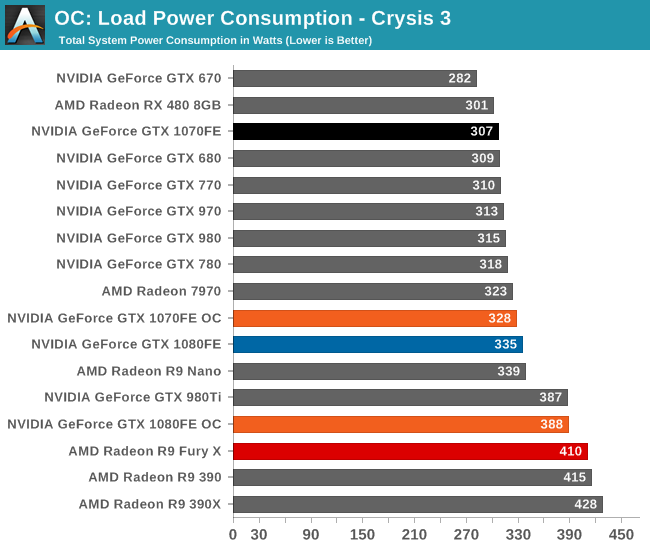
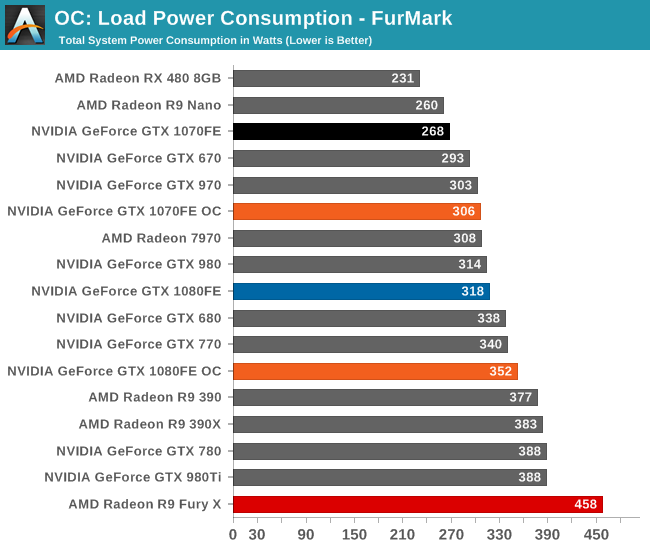
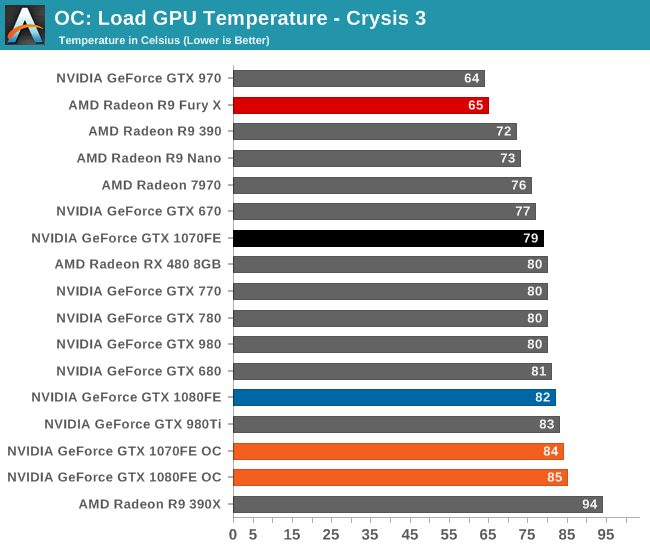
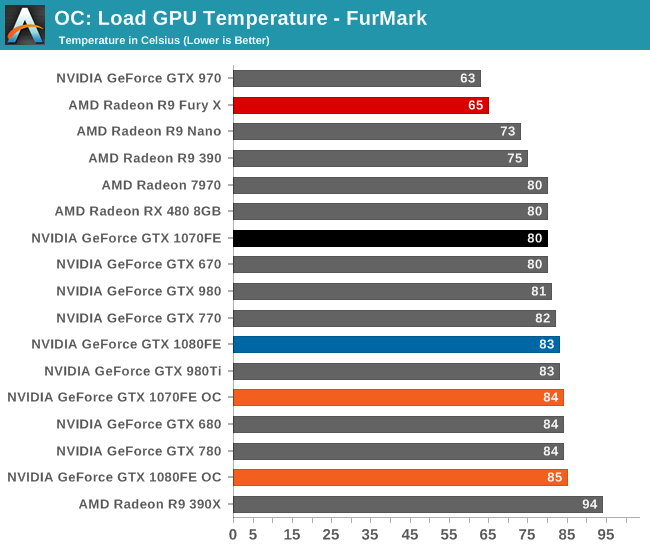
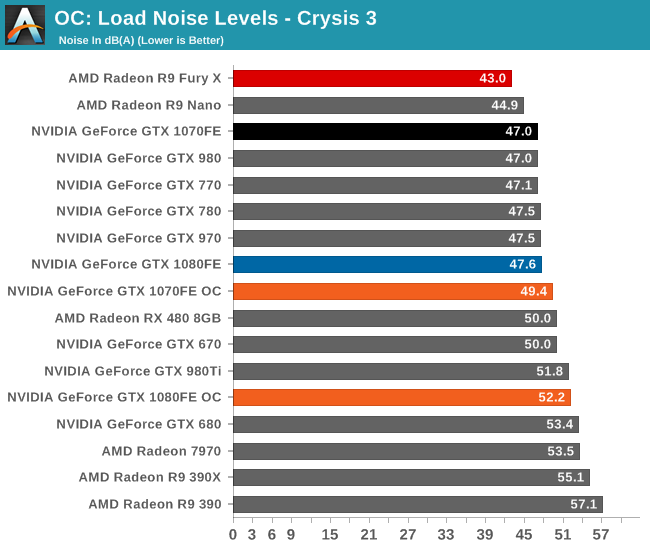
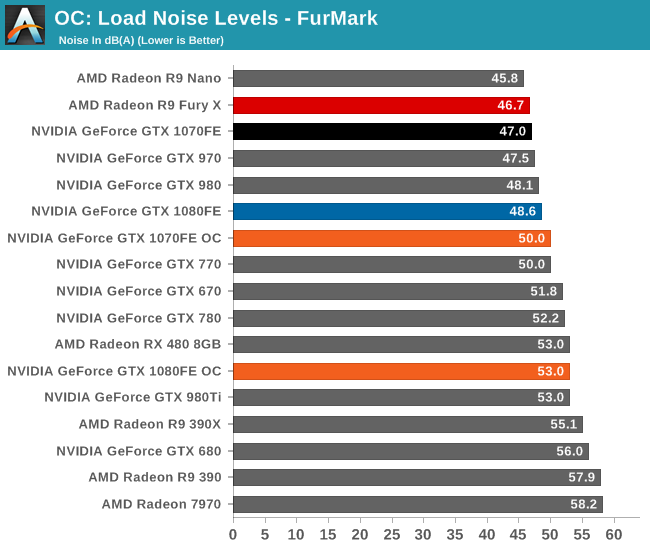
Finally, let’s see the cost of overclocking in terms of power, temperature, and noise. For the GTX 1080FE, the power cost at the wall proves to be rather significant. An 11% Crysis 3 performance increase translates into a 60W increase in power consumption at the wall, essentially moving GTX 1080FE into the neighborhood of NVIDIA’s 250W cards like the GTX 980 Ti. The noise cost is also not insignificant, as GTX 1080FE has to ramp up to 52.2dB(A), a 4.6dB(A) increase in noise. Meanwhile FurMark essentially confirms these findings, with a smaller power increase but a similar increase in noise.
As for the GTX 1070FE, neither the increase in power consumption nor noise is quite as high as GTX 1080FE, though the performance uplift is also a bit smaller. The power penalty is just 21W at the wall for Crysis 3 and 38W for FurMark. This translates to a 2-3dB(A) increase in noise, topping out at 50.0dB for FurMark.


200 Comments
View All Comments
jcardel - Wednesday, July 27, 2016 - link
This is excactly the same situation as me. I got a 770 sitting in my rig, and am looking hard at the 1070, maybe soon. Although my 770 is still up to the task in most games, I really play only blizzard games theese days and they are not hard on your hardware.My biggest issue is really that it is rather noisy, so I will be looking for a solution with the lowest DB.
Great article, it was totally worth waiting for.. I only read this sort of stuff here so have been waiting till now for any 1080 review.
Thanks!
D. Lister - Thursday, July 21, 2016 - link
Nice job, Ryan. Good comeback. Keep it up.Saeid92 - Thursday, July 21, 2016 - link
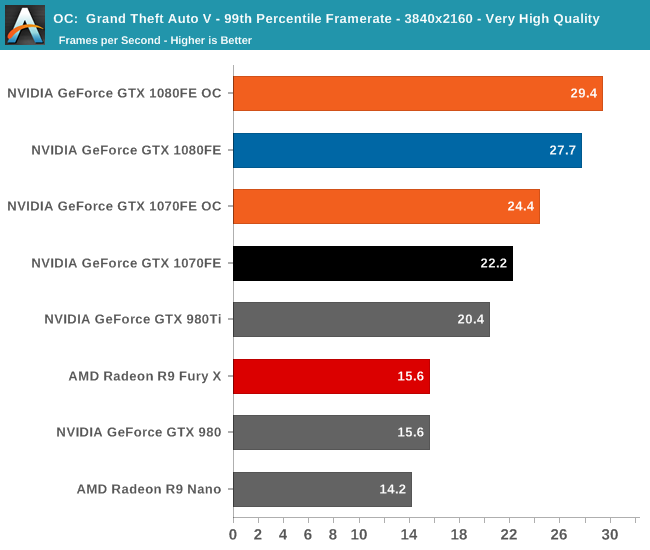
What is 99th procentile framerate?Ryan Smith - Thursday, July 21, 2016 - link
If you sorted the framerate from highest to lowest, this would be the framerate of the slowest 1%. It's basically a more accurate/meaningful metric for minimum frame rates.Eris_Floralia - Thursday, July 21, 2016 - link
This is why I love Anandtech. Deep in reviews. Well I even wanted to be one of your editors if you have the plan to create a Chinese transtate version of these reviews.daku123 - Thursday, July 21, 2016 - link
Typo on FP16 Throughput page. In second paragraph, it should be Tegra X1 (not Tesla X1?).Ryan Smith - Thursday, July 21, 2016 - link
Eyup. Thanks!Badelhas - Thursday, July 21, 2016 - link
Great detailed review, as always. But I have to ask once again:why didnt you do some kind of VR Benchmarks? Thats what drives my choises now, to be honest.
Cheers
Ranger1065 - Thursday, July 21, 2016 - link
After over 2 months of reading GTX1080 reviews I felt a distinct lack of excitementas I read Anandtech kicking off their review of the finfet generation. Could it
prove to be anything but an anticlimax?
Sadly and unsurprisingly...NOT.
It was however amusing to see the faithfull positively gushing praises for Anandtech
now that the "greatly anticipated" review is finally out.
Yes folks, 20 or so pages of (well written) information, mostly already covered by other tech sites,
finally published, it's as if a magic wand has been waved, the information has been presented with
that special Anandtech sauce, new insights have been illuminated and all is well in Anandtechland again.
(AT LEAST UNTIL THE NEXT 2 MONTH DELAY.) LOL.
I do like the way Anandtech presents the FPS charts.
Back to sleep now Anandtech :)
mkaibear - Thursday, July 21, 2016 - link
You've hit the nail on the head here Ranger.The info which is included within the article is indeed mostly already covered by other tech sites.
Emphasis on the "mostly" and the plural "sites".
Those of us who have jobs which keep us busy and have an interest in this sort of thing often don't have the time to trawl round many different sites to get reviews and pertinent technical data so we rely upon those sites which we trust to produce in-depth articles, even if they take a bit longer.
As an IT Manager for (most recently) a manufacturing firm and then a school, I don't care about bleeding edge, get the new stuff as soon as it comes out, I care about getting the right stuff, and a two month delay to get a proper review is absolutely fine. If I need quick benchmarks I'll use someone like Hexus or HardOCP but to get a deep dive into the architecture so I can justify purchases to the Art and Media departments, or the programers is essential. You don't get that anywhere else.