Choosing the Right SSD for a Skylake-U System
by Ganesh T S on May 9, 2016 8:00 AM ESTAnandTech DAS Suite - Power Consumption and Thermal Characteristics
SYSmark 2014 and PCMark 8 provide a high-level view of how the storage device might affect the overall responsiveness of the system. However, when evaluating different SSDs for use in the same system, there are other factors like power consumption and thermal characteristics. In addition, one of the scenarios not considered by either SYSmark 2014 or PCMark 8 is the transfer of large amounts of data (say, a bunch of photos or videos) from a mass storage device to the primary drive in the system. AnandTech's DAS (Direct-Attached Storage) Test Suite covers all these aspects.
The Intel NUC6i5SYK doesn't have a USB 3.1 Gen 2 or Thunderbolt port. Hence, it is difficult, if not, impossible, for an external storage device to keep up with the performance of the PCIe drives inside the system. Therefore, we modified our DAS suite to do the transfer from the primary 120GB partition to the secondary partition of the SSD under test. No RAM drive was set up. The bandwidth and temperature tracking were retained. The test can also reveal whether thermal throttling is triggered due to the transfer of large amounts of data (around 250GB) within a small time window. Before looking at the performance consistency / temperature / bandwidth graphs, let us take a look at the total instantaneous bandwidth numbers for the three different test cases in the DAS test suite.
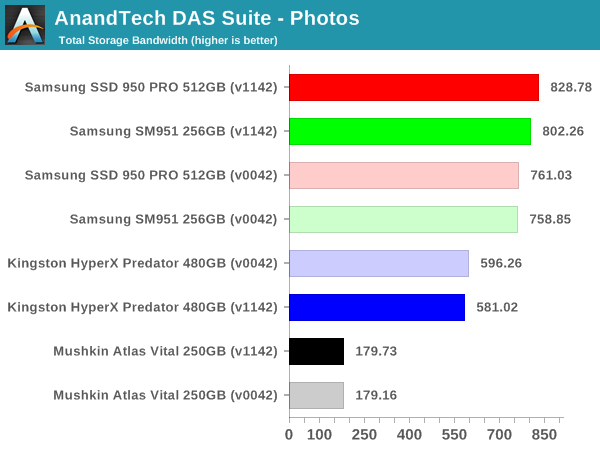
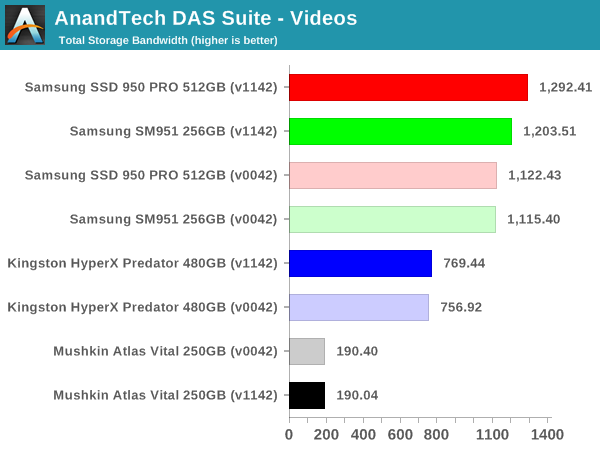
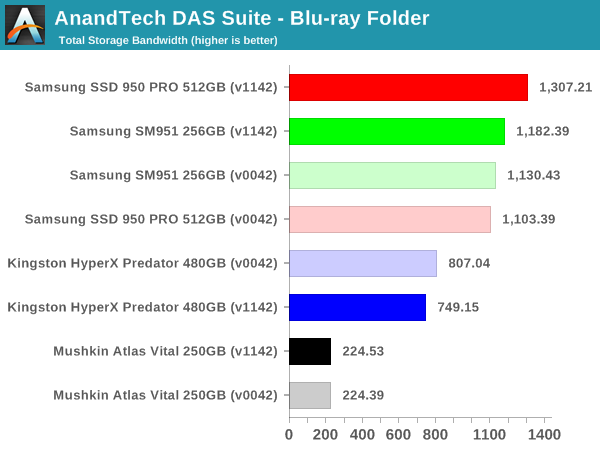
In terms of raw bandwidth and the time taken to finish copying large amounts of data between partitions, the PCIe 3.0 x4 NVMe SSDs obviously win big. However, one must also consider how common this use-case is going to be (given that most external storage devices for Skylake-U systems are not going to keep up with PCIe 2.0 x4 AHCI drives, let alone going to PCIe 3.0 x4 NVMe drives).
The graphs below show the temperature and instantaneous bandwidth numbers for different SSDs with the two BIOS versions. Below that, we also have the power consumed at the wall by the NUC while processing the test suite.
| AnandTech DAS Suite Instantaneous Bandwidth, Thermal Characteristics and At-Wall Power Consumption |
|||
| Mushkin Atlas Vital 250GB MKNSSDAV250GB D8 | Samsung SM951 256GB MZVPV256 | Samsung SSD 950 PRO 512GB | Kingston HyperX Predator 480GB SHPM2280P2H 480G |
-Performance-Consistency.png) |
|||
-Power.png) |
|||
| Mushkin Atlas Vital 250GB MKNSSDAV250GB D8 | Samsung SM951 256GB MZVPV256 | Samsung SSD 950 PRO 512GB | Kingston HyperX Predator 480GB SHPM2280P2H 480G |
The interesting graph to note here is that of the Kingston HyperX Predator SSD. Within a short time after the benchmarking script completes, the drive starts doing power-intensive data shuffling using the huge 1GB DRAM cache on the SSD. We did confirm that the consistently high power draw during the process was not related to any CPU activity. It can also be seen that this background activity in the HyperX Predator is dependent on a number of factors, and the behavior is not always consistent (with the older BIOS, the activity took place without any breaks, but, with the newer BIOS, there were two regions of idling inbetween).
| Intel NUC6i5SYK - Idle Power Consumption | ||||
| Samsung SM951 | Samsung SSD 950 PRO | Kingston HyperX Predator | Mushkin Atlas Vital | |
| OPI GT2 (BIOS v0042) |
7.86 W | 8.46 W | 10.77 W | 7.62 W |
| OPI GT4 (BIOS v1142) |
8.18 W | 10.15 W | 10.78 W | 8.25 W |
Coming back to the quantitative aspects, the tables on either side show the power numbers for the two different link rates (they are slightly different from the numbers in the graphs above, because they only consider the time taken for the test suite to complete, and don't take into account the eventual data shifting done by the controller during idle periods). It can be seen that OPI GT2 is a little bit more power efficient compared to OPI GT4 for the same hardware configuration. The load numbers are a bit different, though, with there being no clear winner across all tested SSDs.
| Intel NUC6i5SYK - Load Power Consumption (AnandTech DAS Suite) | ||||
| Samsung SM951 | Samsung SSD 950 PRO | Kingston HyperX Predator | Mushkin Atlas Vital | |
| OPI GT2 (BIOS v0042) |
22.49 W | 22.49 W | 20.06 W | 17.53 W |
| OPI GT4 (BIOS v1142) |
22.09 W | 22.14 W | 21.24 W | 16.08 W |
The Mushkin Atlas Vital is the most power efficient of the lot (both at load and idle). Even though the Mushkin SSD consumes a lot more energy for the tested task compared to the other SSDs, its idle power is also the lowest. For a desktop running 24x7, it is bound to come out as the better choice for users building a low power computer. The Kingston SSD idles a bit higher compared to the Samsung SSDs, but the load power is lower thanks to the lower transfer rates sustained by former. The number of flash packages and the presence of DRAM in the SSD also influences the power consumption numbers in the above tables. Temperature-wise, all the SSDs ended up between 56 and 59C after the test suite finished processing.


40 Comments
View All Comments
AnnonymousCoward - Monday, May 9, 2016 - link
When will AnandTech realize that synthetic hard drive benchmarks are utterly pointless?http://techreport.com/review/29221/samsung-950-pro...
It's not like you'd round up several graphics cards that produce the same fps, and only run synthetic tests on them to try to show which is fastest. That would be foolish. And that's what's being done with SSDs.
You go as far to claim "those involving heavy multimedia editing and frequent transfers of large-sized files, the PCIe SSDs can definitely provide tangible benefits." How do you know?? If you look at the actual data (in the techreport site), load times of 500-800MB files were pretty much a wash across all the drives. You're misleading readers by only showing PCMark8 and claiming there are tangible benefits.
ganeshts - Monday, May 9, 2016 - link
Dude, did you even read the full article - particularly, the place where the graphs for the 'AnandTech DAS Suite' are displayed? Those graphs are the places where tangible benefit is shown for the PCIe SSDs.In fact, the only place where I have put in 'synthetic hard drive benchmarks' was the CrystalDiskMark comparisons when introducing the four SSDs. Again, that was prefaced with this text: "...it is useful to determine whether the SSDs are operating as per the manufacturer's claimed specifications. It can also help in finding out whether the SSD is connected via the most optimal interface. ..."
In fact, we set out with this article with the sole intention to use ONLY real-world, application-based benchmarks. Please read the article at least once before putting forward an accusation in its comments section.
AnnonymousCoward - Monday, May 9, 2016 - link
It really is a great article, it's well-written, and an interesting read. I'm only focusing on the lack of _real_ real-world benchmarks.You consider SYSmark, PCMark, and DAS to be real-world, but the problem is they aren't. First, I highly question the accuracy: in an actual load time situation, I seriuosly doubt the 950 Pro will be 5x faster than the Mushkin, as PCMark and DAS show. Secondly, these benchmark programs don't give a tangible understanding: seeing a load time difference in "seconds" is tangible, but seeing scores of a thousand is not.
It's really easy to prove this to yourself: use a stopwatch on anything with a load time. If the times are less than 3x of each other (more likely, within 10%) then it will be evident that PCMark and DAS are lying.
ganeshts - Tuesday, May 10, 2016 - link
SYSmark is real-world. Look at their whitepaper if you haven't had a chance to try it out. It actually runs the applications and keeps track of how much time it takes to complete tasks - and it actually shows there is little to no difference between a PCIe AHCI SSD operating at 2.0 x4 and a NVMe SSD operating at 3.0 x4.PCMark - I have linked the PDFs which show how much time it took to complete each workload (real-world trace). The SATA SSD takes around 2 seconds more than the NVMe SSD - and between AHCI and NVMe, it is 0.2 - 0.3s.
The DAS stuff is pretty much as real world as it can be. You have 250GB of data to transfer from one partition to another. The SATA SSD takes 4x the time of the PCIe NVMe SSD. The instantaneous bandwidth numbers are presented in the graph for you to see. Are you saying I am misrepresenting facts?
SYSmark and PCMark are _real_real-world benchmarks - as real-world as you can get if you want highly repeatable benches with reproducible scoring , not something a tech site cooks up on its own (like our DAS suite - which has its own reasons for existence - since we developed it, we can instrument it in ways not possible with third-party benchmarks).
Where does PCMark and DAS say they are representing load time situations? Did you take a look at the PDFs? The PDFs show how much difference is there for the real workload of manipulating images with Photoshop etc. The bandwidth numbers generated by PCMark - I clearly state it is artificial and assumes workload that is not CPU-bound. You should look at the Storage Score to get an idea of how much faster SSD X would be over SSD Y. The bandwidth numbers are only to indicate how the SSDs would perform in a storage-bound situation - Read the explanation preceding the graph.
The DAS suite doesn't talk about load time at all - it notes time taken to transfer a large amount of data from one partition to another. You can see your tangible 'seconds' in those graphs.
Stopwatch and stuff - at the risk of sounding like a broken watch - check the PDFs of the PCMark 8 storage bench results.
rossjudson - Tuesday, May 10, 2016 - link
I'm not sure why FIO isn't used for your benchmarking. Doesn't have the pretty graphs, but it's got scalability and rigor. You're not going to use Crystal to find out how well a PCIe SSD performs at 600K IOPS, or what happens when you're writing maximum sequential load to 4 of them in a single system."What can this hardware do?" and "How will this affect my workload?" are different questions, for sure. I think your application-level benchmarks are quite useful for answering the second. But perhaps not so much for the first.
Or maybe Crystal Diskmark is super-awesome, and FIO's not needed any more. ;)
AnnonymousCoward - Wednesday, May 11, 2016 - link
Your points look technically sound and you clearly have a far better understanding of those benchmark suites than me. The thing is, though, this is confusing. It's not obvious how to take 4 benchmark program results and know how actual computer usage precisely compares.AT got it right here: http://www.anandtech.com/print/1371/ Load times are easy to comprehend and apply to what we care about! And shockingly, RAID-0 won every suite but marginally lost in the simple use-case test.
I can tell you a lot of people have a misconception that RAID-0 SSDs or the 950 Pro load things >3% faster. [reference to the data: http://www.tomshardware.com/reviews/samsung-950-pr...] The misconception is propagated by reviews that show a bunch of graphs with big performance differences and an omission of simple use-cases. I guess users buying a NUC care about boot time, app load time, etc. Why not show the difference. That would certainly be more meaningful than any *Mark suite.
Agent Smith - Monday, May 9, 2016 - link
Not so quick to apologise eah?Experientia docet
Kvaern2 - Monday, May 9, 2016 - link
Much can be read in a username.MrSpadge - Monday, May 9, 2016 - link
"Please read the article at least once before putting forward an accusation in its comments section."Non, no! That's not how the internets are supposed to work ;)
MrSpadge - Monday, May 9, 2016 - link
(Oops, meant to reply to Ganesh's post)