Choosing the Right SSD for a Skylake-U System
by Ganesh T S on May 9, 2016 8:00 AM ESTPCMark 8 Storage Bench
Futuremark's PCMark 8 evaluates the performance of PCs with a variety of benchmarks for different use-case scenarios. We usually present the scenario scores in all our system reviews. It is similar to the SYSmark 2014 scoring in terms of presenting overall effectiveness of the system for day-to-day activities. However, PCMark 8 also includes a dedicated storage benchmark suite.
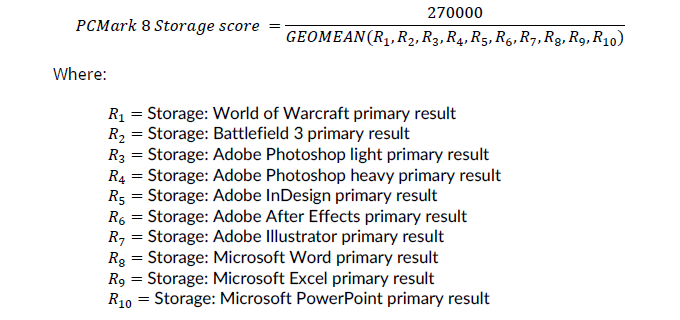
The PCMark 8 Storage test simulates disk activity by playing back a trace of storage activity recorded during actual use of applications from the Adobe Creative Suite, Microsoft Office and a selection of popular games. Idle time compression is is avoided to make the benchmark behave more like real-world applications. The benchmark keeps track of the time taken to complete playback of the trace (termed as the primary result). The secondary result is the total amount of data transferred (both reads and writes) divided by the storage I/O busy time (i.e, time duration during which the number of pending I/O operations was at least 1). The secondary result is a very important metric when idle time compression is involved, but it doesn't matter as much as the primary result when it comes to application responsiveness (as the workload might be CPU-bound, rather than storage-bound).
PCMark 8's technical guide (PDF) explains the formulae used to arrive at the benchmark scores that are presented in the two graphs below.
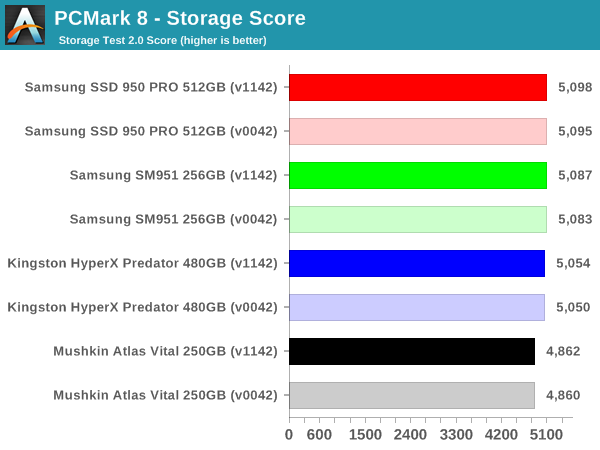
The storage scores reflect what we saw in the SYSmark 2014 results. When it comes to SATA vs. PCIe, there is a significant difference (translates to approximately 1 - 2s differences in the time taken to complete each of the storage traces). However, between AHCI and NVMe, there is not much to choose. In fact, the difference of 30 to 40 points comes from differences as low as 0.1s - 0.4s in the time taken to complete each of the traces. In real-world situations, it is our opinion that this is indiscernible to the end-user.
A detailed breakdown of the time taken to complete each trace for different SSDs in the Skylake NUC6i5SYK using BIOS v1142 is available in the exported storage bench results linked below.
- Mushkin Atlas Vital 250GB (PDF)
- Kingston HyperX Predator 480GB (PDF)
- Samsung SM951 256GB (PDF)
- Samsung SSD 950 PRO 512GB (PDF)
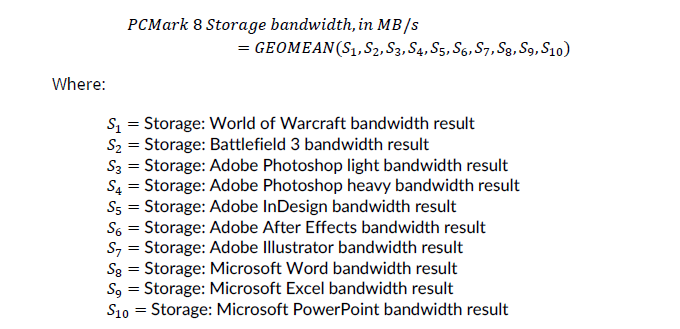
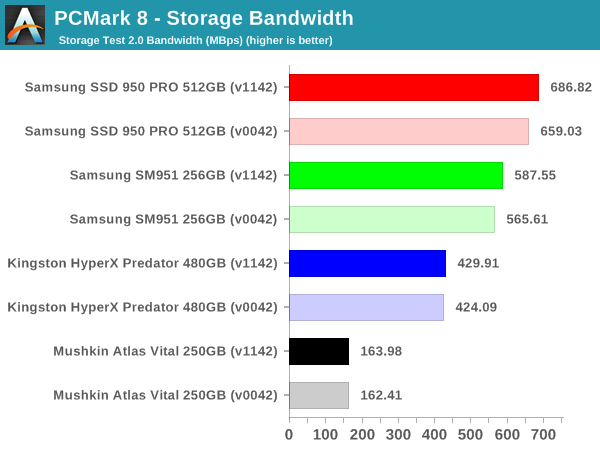
The bandwidth numbers, on the other hand, show that there is a lot to gain by going from SATA to PCIe, and from AHCI to NVMe, and from PCIe 2.0 to PCIe 3.0. However, the gains obtained in each of these upgrades becomes progressively smaller. Current PC usage models (typical of what one might do with a Skylake-U system) have minimal benefit from moving to NVMe or PCIe 3.0 when it comes to application responsiveness.


40 Comments
View All Comments
AnnonymousCoward - Monday, May 9, 2016 - link
When will AnandTech realize that synthetic hard drive benchmarks are utterly pointless?http://techreport.com/review/29221/samsung-950-pro...
It's not like you'd round up several graphics cards that produce the same fps, and only run synthetic tests on them to try to show which is fastest. That would be foolish. And that's what's being done with SSDs.
You go as far to claim "those involving heavy multimedia editing and frequent transfers of large-sized files, the PCIe SSDs can definitely provide tangible benefits." How do you know?? If you look at the actual data (in the techreport site), load times of 500-800MB files were pretty much a wash across all the drives. You're misleading readers by only showing PCMark8 and claiming there are tangible benefits.
ganeshts - Monday, May 9, 2016 - link
Dude, did you even read the full article - particularly, the place where the graphs for the 'AnandTech DAS Suite' are displayed? Those graphs are the places where tangible benefit is shown for the PCIe SSDs.In fact, the only place where I have put in 'synthetic hard drive benchmarks' was the CrystalDiskMark comparisons when introducing the four SSDs. Again, that was prefaced with this text: "...it is useful to determine whether the SSDs are operating as per the manufacturer's claimed specifications. It can also help in finding out whether the SSD is connected via the most optimal interface. ..."
In fact, we set out with this article with the sole intention to use ONLY real-world, application-based benchmarks. Please read the article at least once before putting forward an accusation in its comments section.
AnnonymousCoward - Monday, May 9, 2016 - link
It really is a great article, it's well-written, and an interesting read. I'm only focusing on the lack of _real_ real-world benchmarks.You consider SYSmark, PCMark, and DAS to be real-world, but the problem is they aren't. First, I highly question the accuracy: in an actual load time situation, I seriuosly doubt the 950 Pro will be 5x faster than the Mushkin, as PCMark and DAS show. Secondly, these benchmark programs don't give a tangible understanding: seeing a load time difference in "seconds" is tangible, but seeing scores of a thousand is not.
It's really easy to prove this to yourself: use a stopwatch on anything with a load time. If the times are less than 3x of each other (more likely, within 10%) then it will be evident that PCMark and DAS are lying.
ganeshts - Tuesday, May 10, 2016 - link
SYSmark is real-world. Look at their whitepaper if you haven't had a chance to try it out. It actually runs the applications and keeps track of how much time it takes to complete tasks - and it actually shows there is little to no difference between a PCIe AHCI SSD operating at 2.0 x4 and a NVMe SSD operating at 3.0 x4.PCMark - I have linked the PDFs which show how much time it took to complete each workload (real-world trace). The SATA SSD takes around 2 seconds more than the NVMe SSD - and between AHCI and NVMe, it is 0.2 - 0.3s.
The DAS stuff is pretty much as real world as it can be. You have 250GB of data to transfer from one partition to another. The SATA SSD takes 4x the time of the PCIe NVMe SSD. The instantaneous bandwidth numbers are presented in the graph for you to see. Are you saying I am misrepresenting facts?
SYSmark and PCMark are _real_real-world benchmarks - as real-world as you can get if you want highly repeatable benches with reproducible scoring , not something a tech site cooks up on its own (like our DAS suite - which has its own reasons for existence - since we developed it, we can instrument it in ways not possible with third-party benchmarks).
Where does PCMark and DAS say they are representing load time situations? Did you take a look at the PDFs? The PDFs show how much difference is there for the real workload of manipulating images with Photoshop etc. The bandwidth numbers generated by PCMark - I clearly state it is artificial and assumes workload that is not CPU-bound. You should look at the Storage Score to get an idea of how much faster SSD X would be over SSD Y. The bandwidth numbers are only to indicate how the SSDs would perform in a storage-bound situation - Read the explanation preceding the graph.
The DAS suite doesn't talk about load time at all - it notes time taken to transfer a large amount of data from one partition to another. You can see your tangible 'seconds' in those graphs.
Stopwatch and stuff - at the risk of sounding like a broken watch - check the PDFs of the PCMark 8 storage bench results.
rossjudson - Tuesday, May 10, 2016 - link
I'm not sure why FIO isn't used for your benchmarking. Doesn't have the pretty graphs, but it's got scalability and rigor. You're not going to use Crystal to find out how well a PCIe SSD performs at 600K IOPS, or what happens when you're writing maximum sequential load to 4 of them in a single system."What can this hardware do?" and "How will this affect my workload?" are different questions, for sure. I think your application-level benchmarks are quite useful for answering the second. But perhaps not so much for the first.
Or maybe Crystal Diskmark is super-awesome, and FIO's not needed any more. ;)
AnnonymousCoward - Wednesday, May 11, 2016 - link
Your points look technically sound and you clearly have a far better understanding of those benchmark suites than me. The thing is, though, this is confusing. It's not obvious how to take 4 benchmark program results and know how actual computer usage precisely compares.AT got it right here: http://www.anandtech.com/print/1371/ Load times are easy to comprehend and apply to what we care about! And shockingly, RAID-0 won every suite but marginally lost in the simple use-case test.
I can tell you a lot of people have a misconception that RAID-0 SSDs or the 950 Pro load things >3% faster. [reference to the data: http://www.tomshardware.com/reviews/samsung-950-pr...] The misconception is propagated by reviews that show a bunch of graphs with big performance differences and an omission of simple use-cases. I guess users buying a NUC care about boot time, app load time, etc. Why not show the difference. That would certainly be more meaningful than any *Mark suite.
Agent Smith - Monday, May 9, 2016 - link
Not so quick to apologise eah?Experientia docet
Kvaern2 - Monday, May 9, 2016 - link
Much can be read in a username.MrSpadge - Monday, May 9, 2016 - link
"Please read the article at least once before putting forward an accusation in its comments section."Non, no! That's not how the internets are supposed to work ;)
MrSpadge - Monday, May 9, 2016 - link
(Oops, meant to reply to Ganesh's post)