Choosing the Right SSD for a Skylake-U System
by Ganesh T S on May 9, 2016 8:00 AM ESTPCMark 8 Storage Bench
Futuremark's PCMark 8 evaluates the performance of PCs with a variety of benchmarks for different use-case scenarios. We usually present the scenario scores in all our system reviews. It is similar to the SYSmark 2014 scoring in terms of presenting overall effectiveness of the system for day-to-day activities. However, PCMark 8 also includes a dedicated storage benchmark suite.
The PCMark 8 Storage test simulates disk activity by playing back a trace of storage activity recorded during actual use of applications from the Adobe Creative Suite, Microsoft Office and a selection of popular games. Idle time compression is is avoided to make the benchmark behave more like real-world applications. The benchmark keeps track of the time taken to complete playback of the trace (termed as the primary result). The secondary result is the total amount of data transferred (both reads and writes) divided by the storage I/O busy time (i.e, time duration during which the number of pending I/O operations was at least 1). The secondary result is a very important metric when idle time compression is involved, but it doesn't matter as much as the primary result when it comes to application responsiveness (as the workload might be CPU-bound, rather than storage-bound).
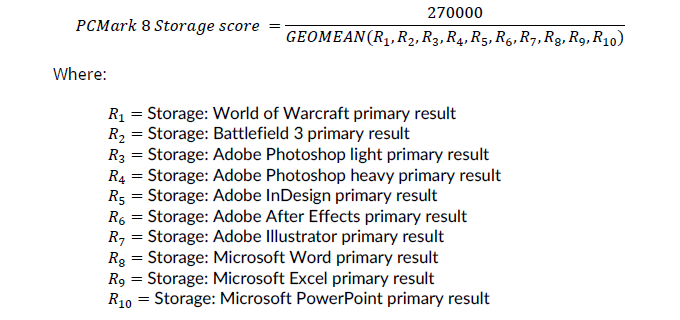
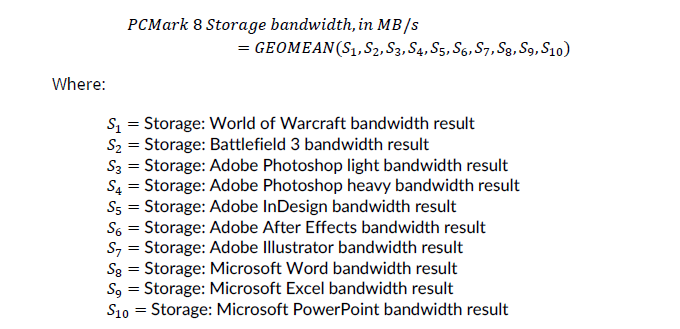
PCMark 8's technical guide (PDF) explains the formulae used to arrive at the benchmark scores that are presented in the two graphs below.
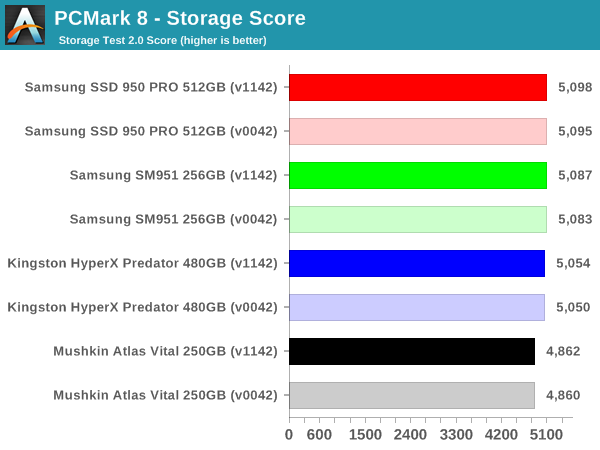
The storage scores reflect what we saw in the SYSmark 2014 results. When it comes to SATA vs. PCIe, there is a significant difference (translates to approximately 1 - 2s differences in the time taken to complete each of the storage traces). However, between AHCI and NVMe, there is not much to choose. In fact, the difference of 30 to 40 points comes from differences as low as 0.1s - 0.4s in the time taken to complete each of the traces. In real-world situations, it is our opinion that this is indiscernible to the end-user.
A detailed breakdown of the time taken to complete each trace for different SSDs in the Skylake NUC6i5SYK using BIOS v1142 is available in the exported storage bench results linked below.
- Mushkin Atlas Vital 250GB (PDF)
- Kingston HyperX Predator 480GB (PDF)
- Samsung SM951 256GB (PDF)
- Samsung SSD 950 PRO 512GB (PDF)
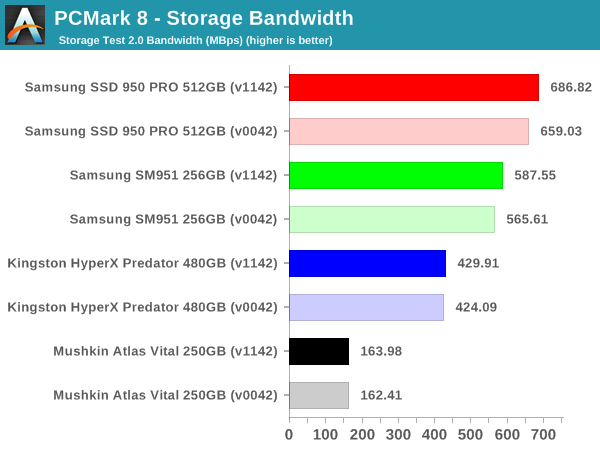
The bandwidth numbers, on the other hand, show that there is a lot to gain by going from SATA to PCIe, and from AHCI to NVMe, and from PCIe 2.0 to PCIe 3.0. However, the gains obtained in each of these upgrades becomes progressively smaller. Current PC usage models (typical of what one might do with a Skylake-U system) have minimal benefit from moving to NVMe or PCIe 3.0 when it comes to application responsiveness.


40 Comments
View All Comments
Kristian Vättö - Monday, May 9, 2016 - link
I just checked all drives that I benchmarked while at AT. The most was 37MB/s (4KB random read QD1), with most SATA drives hovering between 25-30MB/s. The 256GB SM951-NVMe, on the other hand, did 52MB/s.vladx - Monday, May 9, 2016 - link
Yeah, but paying double for that much is definitely not worth it.Haul22 - Tuesday, May 10, 2016 - link
While I believe you that the fastest SATA drives that you tested maxed at 30 MBps in random read tests, what makes you think that this is a limitation/bottleneck of the SATA bus rather than the components inside of the SSD (the controller, the NAND flash chips, the number of NAND flash chips, etc)? I do not understand how Ganesh can make statements like "The bandwidth numbers, on the other hand, show that there is a lot to gain by going from SATA to PCIe, and from AHCI to NVMe, and from PCIe 2.0 to PCIe 3.0. However, the gains obtained in each of these upgrades becomes progressively smaller." While I find your benchmark of the 4 SSDs to be very useful, I don't see how you can draw these kinds of conclusions about SATA vs PCIe or AHCI vs NVMe based on your tests.Also, I don't understand where these 50 MBps and 30 MBps numbers are coming from. Your 850 Pro review from 2014 at http://www.anandtech.com/show/8216/samsung-ssd-850... shows numbers way higher than 30 or 50. Sorry if I'm missing something obvious.
Haul22 - Tuesday, May 10, 2016 - link
Okay I just re-read the article and think the 50 MBps number is coming from the CrystalDiskMark tests. I think these numbers are very low compared to what other tools will produce, even at QD=1. Regardless, I still don't see how we can draw conclusions about SATA vs PCIe or AHCI vs NVMe based on these results.Visual - Thursday, May 12, 2016 - link
I'm totally confused... what are these 30-50MB/s you guys are talking about? Even a crappy USB3 magnetic drive easily does 150MB/s, internal ssds have been pushing the 300MB/s limits of SATA 2 and even 600MB/s of SATA 3 for years now. And before you jump on me with the "random vs sequential" excuse, aren't ssds supposed to make that distinction irrelevant?TheinsanegamerN - Monday, May 9, 2016 - link
The premium is pretty high. A 256GB 950 pro m.2 is $189, a 1TB sata ssd is $209. That is a pretty big difference.Heck, last year I got a 512GB SSD for less than $189.
dzezik - Thursday, May 12, 2016 - link
this is limited by very old sandforce controller not designed for MLC but for SLCvladx - Monday, May 9, 2016 - link
I don't know why would you buy a PCI SSD unless you do a lot video work where you really need the best seq speed. For others , even gamers it's 99% waste of money.jasonelmore - Monday, May 9, 2016 - link
i disagree. Load times in multiplayer games are heavily affected by seq speed. Battlefield 4 is a prime example, where fast load times, equal access to the jets and heli's before anyone else.A5 - Monday, May 9, 2016 - link
Not if you play on a competently admined server. This is what pre-round timers are for.