The ASRock E3V5 Performance Gaming (C232) Motherboard Review
by Ian Cutress on May 4, 2016 9:00 AM EST- Posted in
- Motherboards
- ASRock
- Xeon
- Skylake
- Intel C232
System Performance
Not all motherboards are created equal. On the face of it, they should all perform the same and differ only in the functionality they provide - however this is not the case. The obvious pointers are power consumption, but also the ability for the manufacturer to optimize USB speed, audio quality (based on audio codec), POST time and latency. This can come down to manufacturing process and prowess, so these are tested.
Power Consumption
Power consumption was tested on the system while in a single MSI GTX 770 Lightning GPU configuration with a wall meter connected to the OCZ 1250W power supply. This power supply is Gold rated, and as I am in the UK on a 230-240 V supply, leads to ~75% efficiency > 50W, and 90%+ efficiency at 250W, suitable for both idle and multi-GPU loading. This method of power reading allows us to compare the power management of the UEFI and the board to supply components with power under load, and includes typical PSU losses due to efficiency. These are the real world values that consumers may expect from a typical system (minus the monitor) using this motherboard.
While this method for power measurement may not be ideal, and you feel these numbers are not representative due to the high wattage power supply being used (we use the same PSU to remain consistent over a series of reviews, and the fact that some boards on our test bed get tested with three or four high powered GPUs), the important point to take away is the relationship between the numbers. These boards are all under the same conditions, and thus the differences between them should be easy to spot.
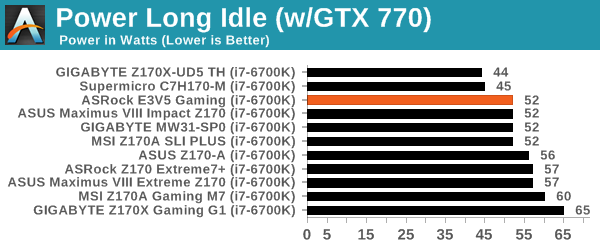

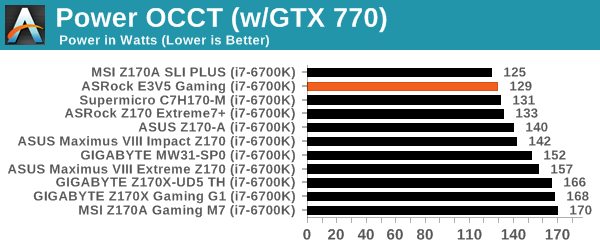
Being a low-end product with both upgraded power delivery and no additional controllers means that we would expect the ASRock E3V5 Performance Gaming to do well in our power tests. While the idle and long idle numbers aren’t the best we’ve seen, the i7-6700K delta from long idle to load is one of the lowest at only 77W, putting the motherboard in our low power band of results when being constantly used.
Non-UEFI POST Time
Different motherboards have different POST sequences before an operating system is initialized. A lot of this is dependent on the board itself, and POST boot time is determined by the controllers on board (and the sequence of how those extras are organized). As part of our testing, we look at the POST Boot Time using a stopwatch. This is the time from pressing the ON button on the computer to when Windows 7 starts loading. (We discount Windows loading as it is highly variable given Windows specific features.)
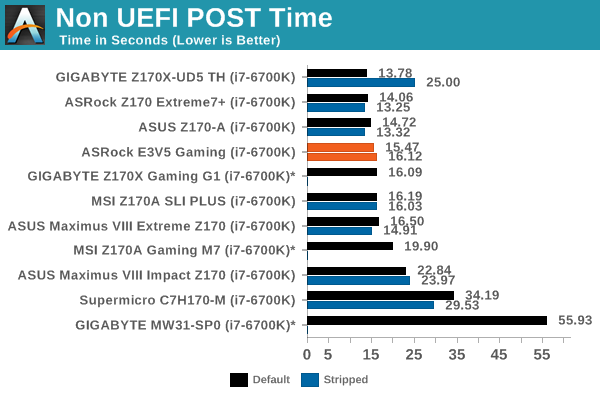
POST Time is still being an odd thing on Skylake based systems, perhaps down to the additional steps required to ensure a proper working system with DDR4. Nonetheless, without extra controllers and a bit of optimization, the ASRock should be doing well here. We scored under 15.50 seconds in our default arrangement, which slightly increased when we ran in a stripped configuration.
Rightmark Audio Analyzer 6.2.5
Rightmark:AA indicates how well the sound system is built and isolated from electrical interference (either internally or externally). For this test we connect the Line Out to the Line In using a short six inch 3.5mm to 3.5mm high-quality jack, turn the OS speaker volume to 100%, and run the Rightmark default test suite at 192 kHz, 24-bit. The OS is tuned to 192 kHz/24-bit input and output, and the Line-In volume is adjusted until we have the best RMAA value in the mini-pretest. We look specifically at the Dynamic Range of the audio codec used on board, as well as the Total Harmonic Distortion + Noise.
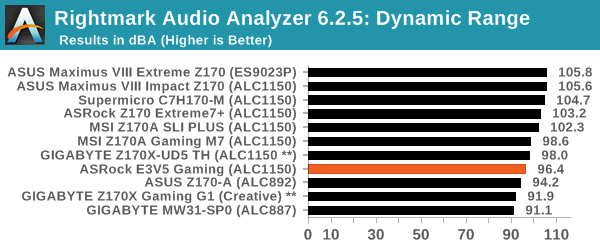
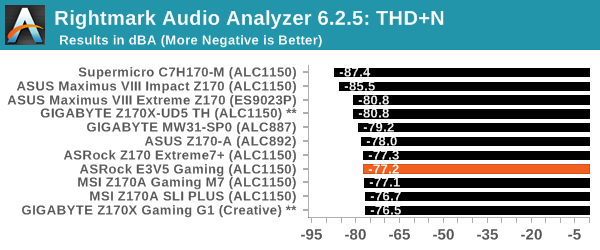
Despite the fact that this motherboard uses a Realtek ALC1150 codec in an ‘enhanced’ arrangement, the results felt eerily reminiscent of a lower performing codec. The Dynamic Range is the big culprit here, scoring only 96.4 dBA, and runs in line with one of the other boards with the ALC1150 we’ve tested.
USB Backup
For this benchmark, we transfer a set size of files from the SSD to the USB drive using DiskBench, which monitors the time taken to transfer. The files transferred are a 1.52 GB set of 2867 files across 320 folders – 95% of these files are small typical website files, and the rest (90% of the size) are small 30 second HD videos. In an update to pre-Z87 testing, we also run MaxCPU to load up one of the threads during the test which improves general performance up to 15% by causing all the internal pathways to run at full speed.
Due to the introduction of USB 3.1, as of June 2015 we are adjusting our test to use a dual mSATA USB 3.1 Type-C device which should be capable of saturating both USB 3.0 and USB 3.1 connections. We still use the same data set as before, but now use the new device. Results are shown as seconds taken to complete the data transfer.
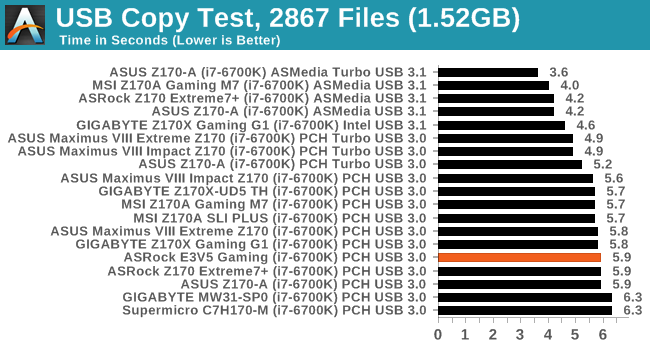
As this motherboard only has USB 3.0 from the chipset, we tested under the default drivers installed with the CD. The performance certainly isn’t great compared to the consumer motherboard stack, but it does beat both the C236 and H170 motherboards we’ve tested.
DPC Latency
Deferred Procedure Call latency is a way in which Windows handles interrupt servicing. In order to wait for a processor to acknowledge the request, the system will queue all interrupt requests by priority. Critical interrupts will be handled as soon as possible, whereas lesser priority requests such as audio will be further down the line. If the audio device requires data, it will have to wait until the request is processed before the buffer is filled.
If the device drivers of higher priority components in a system are poorly implemented, this can cause delays in request scheduling and process time. This can lead to an empty audio buffer and characteristic audible pauses, pops and clicks. The DPC latency checker measures how much time is taken processing DPCs from driver invocation. The lower the value will result in better audio transfer at smaller buffer sizes. Results are measured in microseconds.
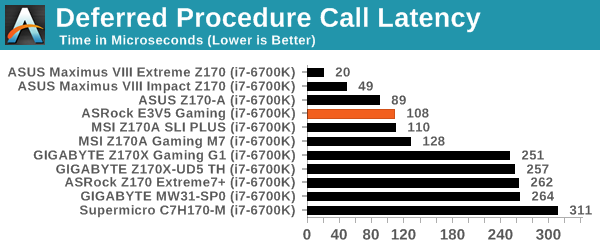
One of ASRock’s continuing projects internally is getting a better result for DPC latency. Scoring around 100 here is a good benchmark result, especially given some of the dire results we’ve seen on Skylake platforms so far.


22 Comments
View All Comments
xKrNMBoYx - Monday, May 9, 2016 - link
Two things wrong I see from skipping through the review.1) There ARE 1200 V5 models that have an IGP. The 12X5 V5 models all have an IGP (like my 1275 V5)
2) OCing is still possible with the motherboard. You either stick with the oldest/first BIOS or use the latest beta BIOS (1.3)
Alfredly - Wednesday, May 25, 2016 - link
Just got this board plus skylake xeon, so much fun overclocking it. As it is one of its kind, this board's oc function was its selling point for me.