The Intel Xeon E5 v4 Review: Testing Broadwell-EP With Demanding Server Workloads
by Johan De Gelas on March 31, 2016 12:30 PM EST- Posted in
- CPUs
- Intel
- Xeon
- Enterprise
- Enterprise CPUs
- Broadwell
Benchmark Configuration and Methodology
All of our testing was conducted on Ubuntu Server 14.04 LTS. Admittedly, that might seem like an old distribution to some of our readers, but enterprises prefer stability and support over the latest software. We did upgrade this distribution to the latest release (14.04.4), which gives us more extensive hardware support.
To make things more interesting, we tested 4 different SKUs and included the previous generation Xeon E5 v3s, the Xeon E5-2697v2 (high end Ivy Bridge EP), and the E5-2690 (high end Sandy Bridge EP). We even included the Xeon X5680 for comparison reasons. The Xeon E5-2695 v4 is interesting to compare to the Xeon E5-2699 v3 as it has the same core count and more or less the same clockspeed. That way we could quantify the improvement that the Broadwell core offers over the Haswell core.
Last but not least, we want to note how the performance graphs have been color-coded. Orange is the latest generation (v4), dark blue the previous one (v3), and light blue is the generation that the current (v4) is (arguably) supposed to replace (Xeon E5 v1).
Intel's Xeon E5 Server – S2600WT (2U Chassis)
| CPU | Two Intel Xeon processor E5-2699v4 (2.2 GHz, 22c, 55MB L3, 145W) Two Intel Xeon processor E5-2695v4 (2.1 GHz, 18c, 45MB L3, 145W) Two Intel Xeon processor E5-2699v3 (2.3 GHz, 18c, 45MB L3, 145W) Two Intel Xeon processor E5-2695v3 (2.3 GHz, 14c, 35MB L3, 120W) Two Intel Xeon processor E5-2667v3 (3.2 GHz, 8c, 20MB L3, 135W) |
| RAM | 128GB (8x16GB) Kingston DDR-2400 |
| Internal Disks | 2x Intel SSD3500 400GB |
| Motherboard | Intel Server Board Wildcat Pass |
| Chipset | Intel Wellsburg B0 |
| BIOS version | 1/28/2016 |
| PSU | Delta Electronics 750W DPS-750XB A (80+ Platinum) |
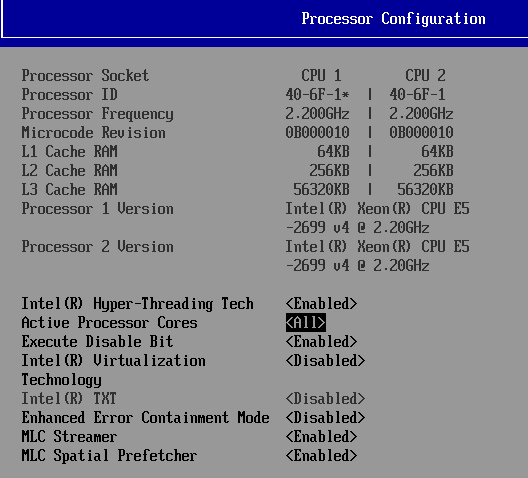
The typical BIOS settings can be seen below.
SuperMicro 6027R-73DARF (2U Chassis)
| CPU | Two Intel Xeon processor E5-2697 v2 (2.7GHz, 12c, 30MB L3, 130W) Two Intel Xeon processor E5-2690 (2.9GHz, 8c, 20MB L3, 135W) |
| RAM | 128GB (8x16GB) Samsung at 1866 MHz |
| Internal Disks | 2x Intel SSD3500 400GB |
| Motherboard | SuperMicro X9DRD-7LN4F |
| Chipset | Intel C602J |
| BIOS version | R 3.0a (December the 6th, 2013) |
| PSU | Supermicro 740W PWS-741P-1R (80+ Platinum) |
All C-states are enabled in both the BIOS.
Other Notes
Both servers are fed by a standard European 230V (16 Amps max.) power line. The room temperature is monitored and kept at 23°C by our Airwell CRACs.


112 Comments
View All Comments
SkipPerk - Friday, April 8, 2016 - link
"Anyone putting Microsoft on bare hardware these days is nuts"This brother is speakin the truth!
warreo - Thursday, March 31, 2016 - link
Can someone clarify this line for me?"The average performance increase versus the Xeon E5-2690 is 3%, and the Broadwell cores get a boost of no less than 19%."
Does that mean IPC increase is 19% for Broadwell, offset by ~16% decline in clockspeed to get to 3% average performance increase? But that doesn't make sense to me as a 3.8ghz (E5-2690) to 3.6ghz (E5-2699 v4) is only 5% decline in max clockspeed?
ShieTar - Thursday, March 31, 2016 - link
I understood it as "the -Ofast setting boosts Broadwell by 19%", so with the -O2 setting it was actually 16% slower than the 2690.And I think the AT-Theory based on the original measurements is that the 3.6GHz boost are not even held for a significant amount of time, so that Broadwell in reality comes with an even worse decline in clock speed.
warreo - Thursday, March 31, 2016 - link
Your interpretation makes much more sense than mine, but still doesn't quite add up. The improvement from using -Ofast vs. -O2 is 13% on average, and the lowest improvement is 4% on the xalancbmk, well below the "no less than 19%" quoted by Johan.Perhaps the rest of the disparity is normalizing for sustained clock speeds as you suspect? Johan is that correct?
Ryan Smith - Thursday, March 31, 2016 - link
I've reworded that passage to make it clearer. But ShieTar's interpretation was basically correct."Switching from -O2 to -Ofast improves Broadwell-EP's absolute performance by over 19%. Meanwhile the relative performance advantage versus the Xeon E5-2690 averages 3%. "
JohanAnandtech - Thursday, March 31, 2016 - link
That means that the -ofast has much more effect on the Broadwell. I mean by that that -ofast is 19% faster than -o2 on Broadwell, while it is 3% faster on Sandy Bridge. I assume that the older the architecture, the better the compiler is able to optimize it without special tricks.warreo - Friday, April 1, 2016 - link
Thanks for the clarification. Loved the review, great work Johan!Pinn - Thursday, March 31, 2016 - link
I'm still happy I went with the 6 core x99 over the 8 core. Massive core count is nice to see available, but I don't see the true value. Looks like you have to do the same rough math to see if the clock speed reduction is worth the core count.Oxford Guy - Tuesday, April 5, 2016 - link
Why would there be "true value" for six and not for eight?Pinn - Wednesday, April 6, 2016 - link
Single threaded workloads.