SanDisk Ultra +Cloud 64GB + 64GB Flash Drive Review
by Ganesh T S on February 18, 2016 7:30 AM EST- Posted in
- Storage
- USB 3.0
- Flash Drive
- SanDisk
- Cloud Storage
Direct-Attached Storage Performance
Evaluation of DAS units on Windows is done with the testbed outlined in the table below. For devices with USB 3.0 connections (such as the SanDisk Ultra +Cloud that we are considering today), we utilize the USB 3.0 port directly hanging off the PCH.
| AnandTech DAS Testbed Configuration | |
| Motherboard | Asus Z97-PRO Wi-Fi ac ATX |
| CPU | Intel Core i7-4790 |
| Memory | Corsair Vengeance Pro CMY32GX3M4A2133C11 32 GB (4x 8GB) DDR3-2133 @ 11-11-11-27 |
| OS Drive | Seagate 600 Pro 400 GB |
| Optical Drive | Asus BW-16D1HT 16x Blu-ray Write (w/ M-Disc Support) |
| Add-on Card | Asus Thunderbolt EX II |
| Chassis | Corsair Air 540 |
| PSU | Corsair AX760i 760 W |
| OS | Windows 8.1 Pro |
| Thanks to Asus and Corsair for the build components | |
The full details of the reasoning behind choosing the above build components can be found here. The list of DAS units used for comparison purposes is provided below.
- SanDisk Ultra Plus Cloud 64GB
- Mushkin Atom 64GB
- SanDisk Extreme 64GB
- Strontium Nitro Plus Nano 64GB
Synthetic Benchmarks - ATTO and Crystal DiskMark
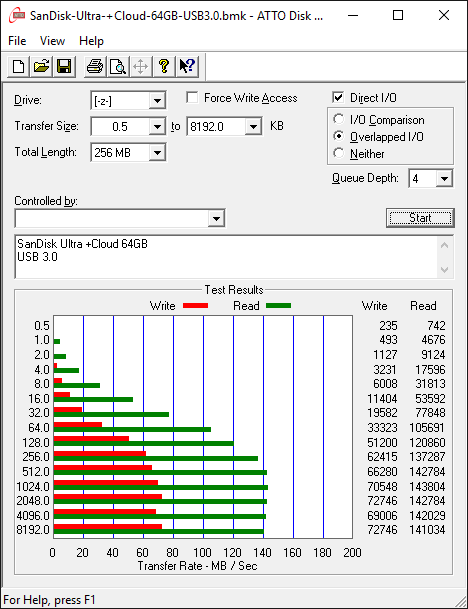
SanDisk claims read and write speeds of more than 100 MBps and around 50 MBps respectively, and these are backed up by the ATTO benchmarks provided below. Unfortunately, these access traces are not very common in real-life scenarios.
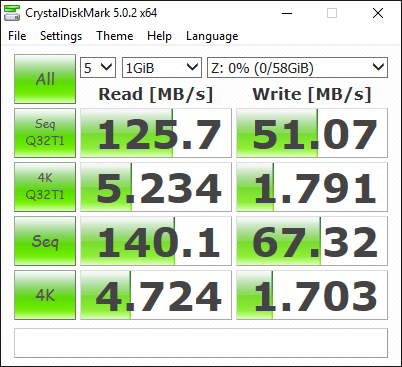
CrystalDiskMark, despite being a canned benchmark, provides a better estimate of the performance range with a selected set of numbers. As evident from the screenshot below, the performance can dip to as low as 1.7 MBps for 4K random writes (understandably not the typical usage scenario for UFDs)
Benchmarks - robocopy and PCMark 8's Storage Bench
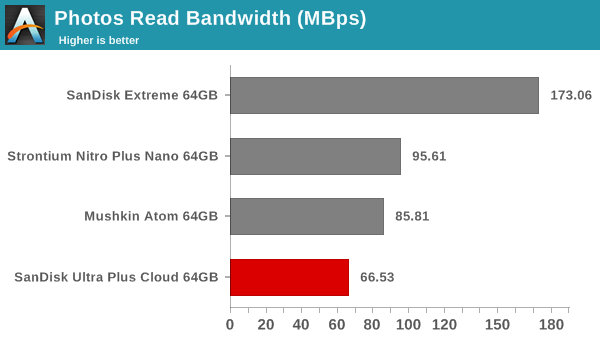
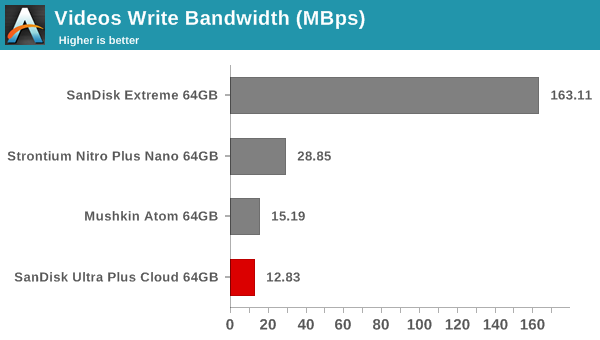
Our testing methodology for DAS units also takes into consideration the usual use-case for such devices. The most common usage scenario is transfer of large amounts of photos and videos to and from the unit. The minor usage scenario is importing files directly off the DAS into a multimedia editing program such as Adobe Photoshop.
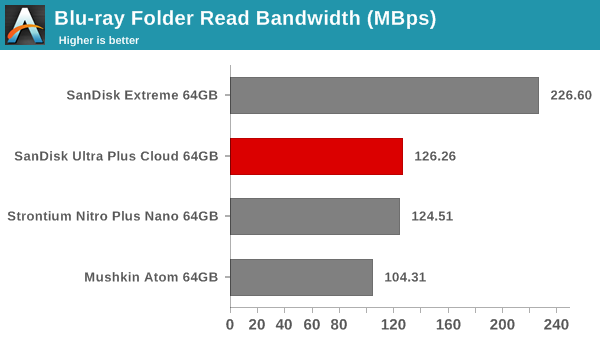
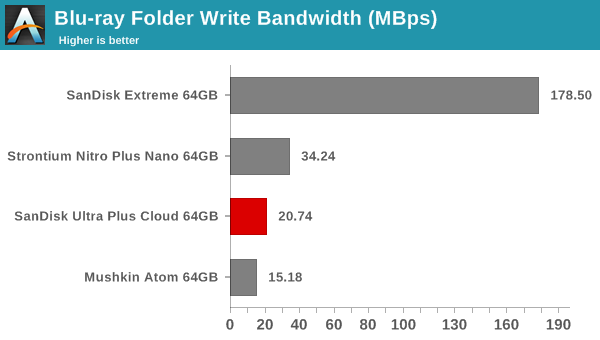
In order to tackle the first use-case, we created three test folders with the following characteristics:
- Photos: 15.6 GB collection of 4320 photos (RAW as well as JPEGs) in 61 sub-folders
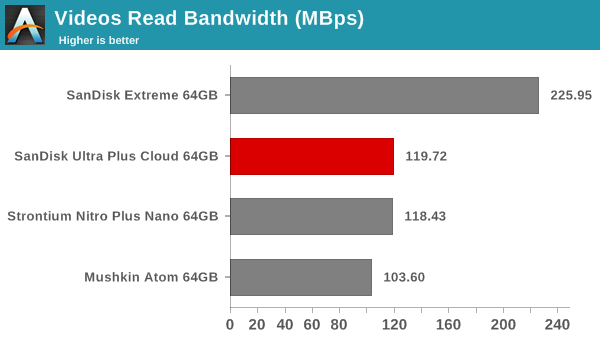
- Videos: 16.1 GB collection of 244 videos (MP4 as well as MOVs) in 6 sub-folders
- BR: 10.7 GB Blu-ray folder structure of the IDT Benchmark Blu-ray (the same that we use in our robocopy tests for NAS systems)

For the second use-case, we have traditionally used PC Mark 8's storage bench. However, our recent update to the benchmark program has rendered comparisons with earlier results invalid. The storage workload involves games as well as multimedia editing applications. The command line version allows us to cherry-pick storage traces to run on a target drive. We chose the following traces.
- Adobe Photoshop (Light)
- Adobe Photoshop (Heavy)
- Adobe After Effects
- Adobe Illustrator
Usually, PC Mark 8 reports time to complete the trace, but the detailed log report has the read and write bandwidth figures which we present in our performance graphs. Note that the bandwidth number reported in the results don't involve idle time compression. Results might appear low, but that is part of the workload characteristic. The Photoshop light editing access traces benchmarked with reads at 3.86 MBps and writes at 16.35 MBps. The heavy access trace benchmarked at 5.14 MBps reads and 21.23 MBps writes. The After Effects access trace benchmarked with reads at 4.41 MBps and writes at 2.83 MBps. The Illustrator reads were at 9.68 MBps and writes at 15.48 MBps.
Performance Consistency
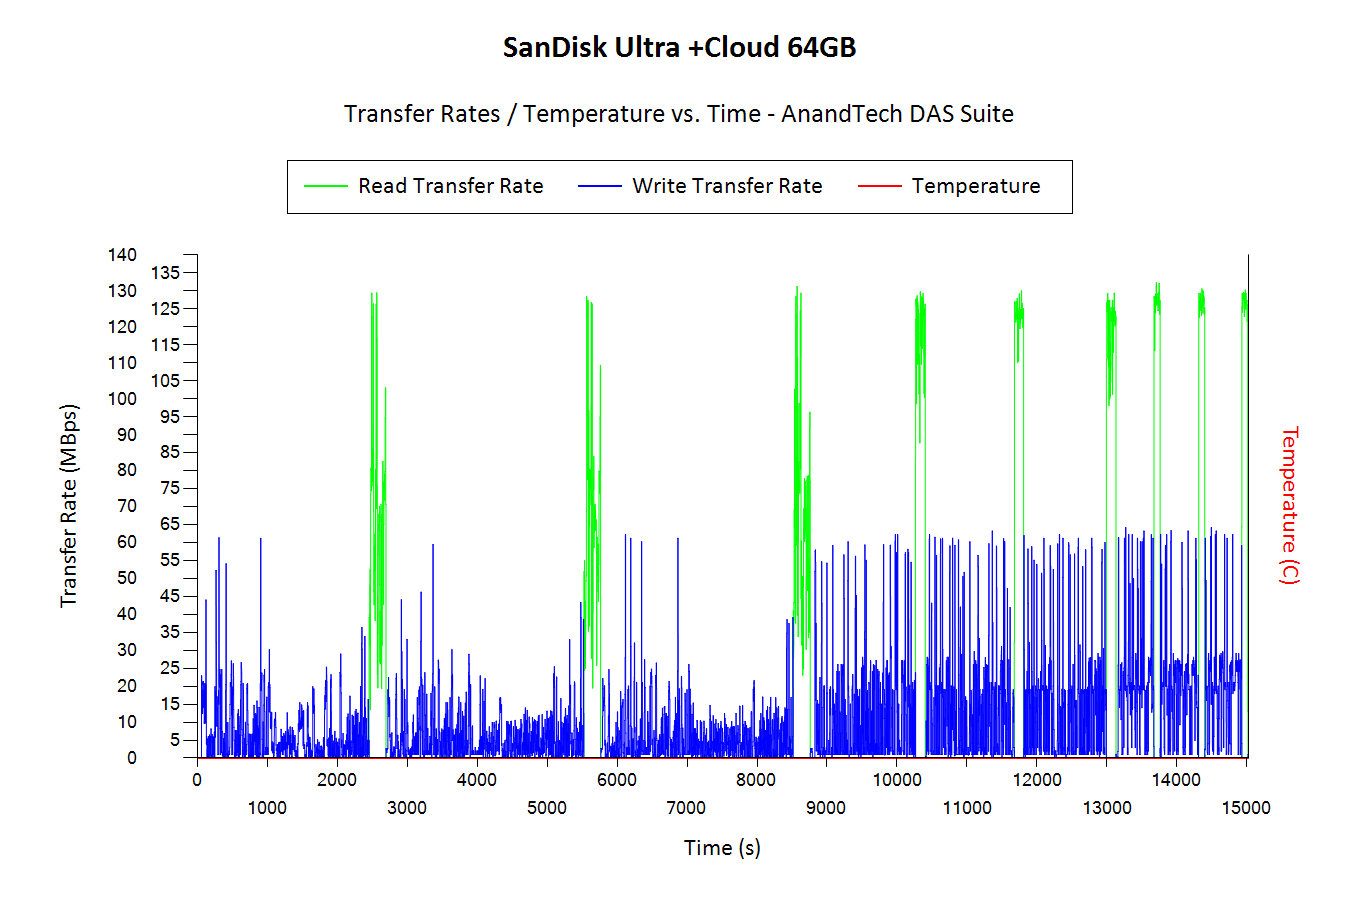
Yet another interesting aspect of these types of units is performance consistency. Aspects that may influence this include thermal throttling and firmware caps on access rates to avoid overheating or other similar scenarios. This aspect is an important one, as the last thing that users want to see when copying over, say, 50 GB of data to the flash drive, is the transfer rate going to USB 2.0 speeds. In order to identify whether the drive under test suffers from this problem, we instrumented our robocopy DAS benchmark suite to record the flash drive's read and write transfer rates while the robocopy process took place in the background. For supported drives, we also recorded the internal temperature of the drive during the process. The graphs below show the speeds observed during our real-world DAS suite processing. The first three sets of writes and reads correspond to the photos suite. A small gap (for the transfer of the videos suite from the primary drive to the RAM drive) is followed by three sets for the next data set. Another small RAM-drive transfer gap is followed by three sets for the Blu-ray folder.
An important point to note here is that each of the first three blue and green areas correspond to 15.6 GB of writes and reads respectively. Throttling, if any, is apparent within the processing of the photos suite itself. It is evident that there is no throttling at play here. The write transfer rates in the 'Photos' data set is quite low - almost USB 2.0 speeds, though these improve a bit for the larger files in the other data set. The instantaneous spikes to 55 - 60 MBps for UFD writes in the Videos and Blu-ray folder transfers regularly seem to indicate some sort of fast first-level memory (SLC cache, possibly) in the flash drive.


21 Comments
View All Comments
shilpamalhotra - Wednesday, May 4, 2016 - link
Pleasant article. Think so new type of elements have incorporated into your article. Sitting tight for your next article.My Website - http://www.delhigurgaon.in