Overclocking Extravaganza: GTX 275's Complex Characteristics
by Derek Wilson on June 4, 2009 5:35 AM EST- Posted in
- GPUs
Raw Performance Data
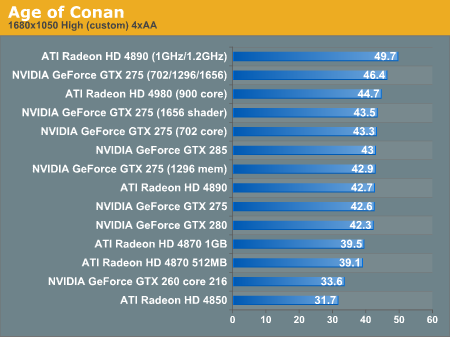
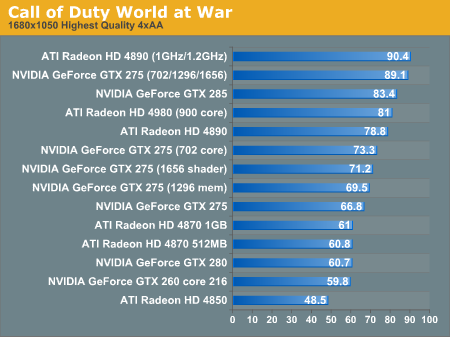
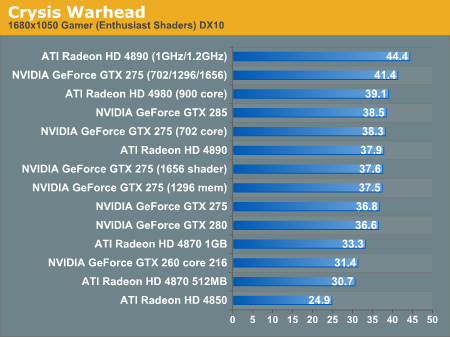
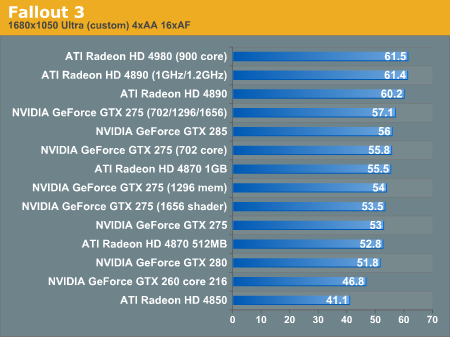
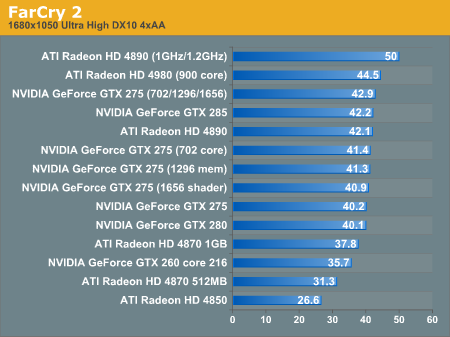
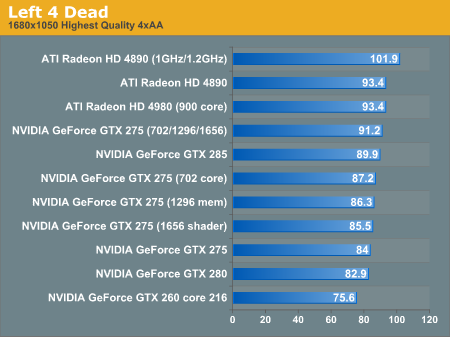
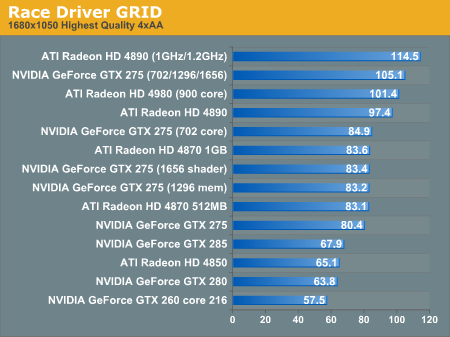
Here are the graphs with raw data for all seven of the games we tested. Once again we've got our standard bar graphs at each resolution. We opted not to include the scaling graphs this time around, as we didn't feel they added that much and they can get a little cluttered. All the numbers are here, and as we can see, the GTX 275 does a good job of staying at or near the top when it is fully overclocked. The Radeon HD 4890 doesn't always lead the GTX 275, but it does come in on top a fair amount as well. Often these cards trade blows at different resolutions.
1680x1050 1920x1200 2560x1600
1680x1050 1920x1200 2560x1600
1680x1050 1920x1200 2560x1600
1680x1050 1920x1200 2560x1600
1680x1050 1920x1200 2560x1600
1680x1050 1920x1200 2560x1600
1680x1050 1920x1200 2560x1600


43 Comments
View All Comments
serrias - Monday, June 8, 2009 - link
Sorry if its been posted, But the math is wrong :S...Thats like saying.. you have 3 people (each one represents either memory,core or shader) they are all making wallets, and can each do 10 in an hour.
That means 3 people x 10 wallets per hour = 30 wallets a hour total.
Then you tell them each to work 10% faster...... Therefore..
Wallet maker one does 11 wallets a hour (1.1x10=11)
Wallet maker two also does 11 wallets a hour (1.1x10=11)
And Wallet maker Three also does 11 wallets a hour (1.1x10=11).
This equates to 33 wallets an hour (for a 10% increase from each wallet maker)
This is still overall just a 10% increase in performance.
Now onto the artical, It is impossible to get a performance increase above the amount overclocked... Right?.... The highest overclock here was about 17% on the shader if i remember right
(So by my math even if the core and memory were also 17% overclocks it would still just be 17% faster overall... From my example above)
.. This all makes it definatly impossible to get a 30%+ increase.
Sorry, But this artical is screwed up.
Tigashark - Monday, June 8, 2009 - link
Serias you are making the assumption that the core , shader and mem are all performing the same job "Making wallets" and therefore the performance improvement should increase in a linnear fashionUsing your wallet maker example , changing the layout of their workspace by "10%" might lead to a 20% increase in efficiency and corresponding 20% increase in wallets per hour
the shader and core clocks obviously have a multiplicive relationship , not an additive one and the core and shader clocks are obviously helping eachother do their job more efficiently in some manner .
Im sure an Nvidia engineer would be able to answer the "why" of this ;)
Science is based on theory -> experiment -> observation ->conclusion (and maybe another round of experiments if the results dont fit your theory)
In this case your trying to say "but my theory must be right so the observed results are wrong"
Thats like saying "the world is flat so something else must be happening when people circumnavigate the earth , cos it couldnt possibly be that its not flat"
Bottom line you can throw as much theory at this as you like , the
Observed results speak for themselves .
Great article btw :)
Tigashark - Monday, June 8, 2009 - link
Meant to sayScience is based on theory -> experiment -> observation ->conclusion and if need be - > REVISION
(if the results dont fit the theory , you revise the theory untill it explains the results , THEN retest)
serrias - Tuesday, June 9, 2009 - link
You are correct in how the core, shader and memory are seperate, and how those seperate things are unlinked and affect the framerates in very differnt proportions, I did originally think about this... But I just to make it more understandable... I used a simplified example to show it. It still is incorrect though.The basic principal is the same, You cannot achieve a larger performance increase the the percentage you originally increased from.
The wallet making example was suitable for simple understanding , Using that example you are correct, If you did for increase workspace by 10% you may get a 20% increase in wallets per hour, the only case where this could happen is where the workspace is the limiting factor, and the increase is because perviously he could only fit say 90% of the needed materials on the desk, whereas now he can fit 100% and work at a much faster rate (seeing as he dosnt need to go back and get more materials half way through.)
But, This does not apply to a GPU efficiency because its just a differnt enviroment.
Im sorry but no matter what, It is definatly impossible to overclock three components by 17% 10% and 10% (or whatever the review said) and achieve a theoretical performance improvement of 50%, with a actual of up to 32%... Perhaps by freak occourance may happen to around 19-20%, But that would be driver issues and inperfections in architecture, No way would 32% be possible!!!
serrias - Tuesday, June 9, 2009 - link
Oh yeah, finally,Its obviously ridiculous if the clocks have a multiplying increase
(xxx*xxx*xxx = total percentage is not right.)
Let me put this into simpler terms so you can understand....
That is the same as using your analogy...
if you decrease the clocks by 50% on each one you will come out with
0.5*0.5*0.5=0.125
So thats like saying if you run 50% of the speed youll get 12.5% of the performance
Or.. even more stupid...
0.2*0.2*0.2=0.008
If you run 20% of the original core speed you get 0.8% of the original performance
Or the other way round... a 50% clock increase on all components (actually possible on some GPU's) would be
1.5*1.5*1.5 = 3.375
So a 50% increase in clocks means a thoretical increase of 337.5% ..... :S
So can you see now how it is clear that you cannot multiply the percentage increase to determin theoretical MAXIMUM performance... (Maximum reffering to the pervious running at 20% of clock speeds = 0.8% MAXIMUM performance.... (Have to follow same rules for all equations)
tenq - Monday, July 26, 2010 - link
China wholesale electronicsChina wholesale from wholesaleonepiece.com
www.wholesaleonepiece.com
mypapayaone - Monday, June 8, 2009 - link
China wholesale electronicsChina wholesale from papayaone
http://www.papayaone.com/">http://www.papayaone.com/
helldrell666 - Saturday, June 6, 2009 - link
Extremely useful Data Mr. Derek.I just love your articles.Your one of the great guys at anandtech who keep anandtech unique in every single way.KhadgarTWN - Friday, June 5, 2009 - link
A great review, but the problem is still there,4890 perform far worse in reality than these canned benchmark
My 4890 has no change on par with GTX 275 at 1920x1200 on most of game.... I have them both on E8500
SiliconDoc - Saturday, June 6, 2009 - link
If you notice the games also have some customized settings and the 4890 they used was a special for their eyes only manufacturer direct channel non retail version ! LOLYes of course, the red rooster BS here is so thick it's PATHETIC.
http://www.anandtech.com/video/showdoc.aspx?i=3555...">http://www.anandtech.com/video/showdoc.aspx?i=3555...
---
"We absolutely must caution our readers once again that these are not off-the-shelf retail parts. These are parts sent directly to us from manufacturers and could very likely have a higher overclocking potential than retail parts."
---
Yes, caution us way down into page 3 of the 4890 extravaganza review - but just COPY AND PASTE those special card numbers here and NEVER MENTION IT - and put a sappy 703 core on the GTX275 and call it "extravaganza!"
----
Yes, your 275 whomps the 4890 in real life - that's why they have to go through maxxing it out for 4890 here to get what they got - a specially OC'able card from manufacturer - specialized custom game settings and ati favorable games in the majority - a great oc on ati not even achievable retail, and a crappy oc on nvidia that RETAIL BEATS ! http://www.newegg.com/Product/Product.aspx?Item=N8...">http://www.newegg.com/Product/Product.aspx?Item=N8...
---
Yeah, just really grewat and valuable data as hell666 says the next page... because he doesn't have a clue, he's bleeding out red rooster all over.