Hitachi Deskstar 7K1000 in RAID 0: Is Two Terabytes really better than One?
by Gary Key on April 19, 2007 12:15 AM EST- Posted in
- Storage
Actual Application Performance
Our application benchmarks are designed to show application performance results with times being reported in seconds, with lower scores being better. While these tests will show some differences between the drives it is important to understand we are no longer measuring the pure performance of the hard drive but how well our platform performs with each individual drive. In that sense, these are the more real-world tests that show how hard drives and RAID 0 can impact your everyday computer use.
The performance of a hard drive is an integral part of the computer platform but other factors such as memory, CPU, core logic, and even chipset driver choices can play a major role in determining how well the hard drive performs in any given task. Also worth noting is that new features of Windows Vista - specifically SuperFetch - can further reduce the measured performance differences between hard drives.
Game Load Tests
In our Half-Life 2: Lost Coast test we measure the time it takes to load the game with the application timer starting when the play game icon is initiated in the Steam menu until the main game menu appears.
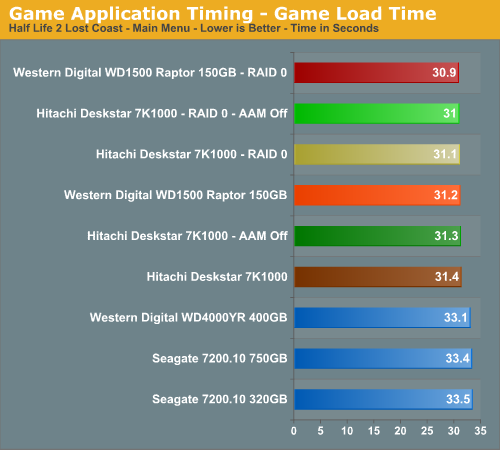
The results speak for themselves with the RAID 0 setups offering extremely minor performance improvements in actual game load testing. You will likely not be able to notice any differences during actual game play with a RAID 0 setup. We know it was impossible for us.
Our Sims 2 - Open for Business test measures the time it takes to load the initial portion of the game. Our application timer starts when the game icon is initiated until the neighborhood menu appears.
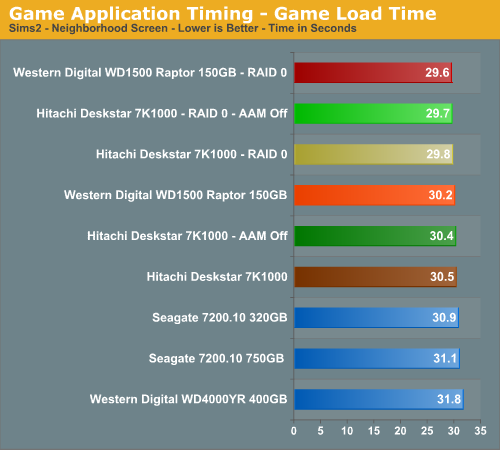
We witnessed 38% to 50% improvements in our iPeak tests in this game but measure less than a 2% difference in actual game load times. Without a benchmark, these differences are impossible to witness during actual game play. Once again, we see the Raptors slightly ahead but the 7K1000 for all intents and purposes is even in our game benchmarks.
Game Level Load
This test centers on the actual loading of a playable level within our game selections. We run Battlefield 2 and measure the time it takes to load the Daqing Oilfields level. Our application timer begins when the start single player icon is initiated and ends when the join game icon is visible.
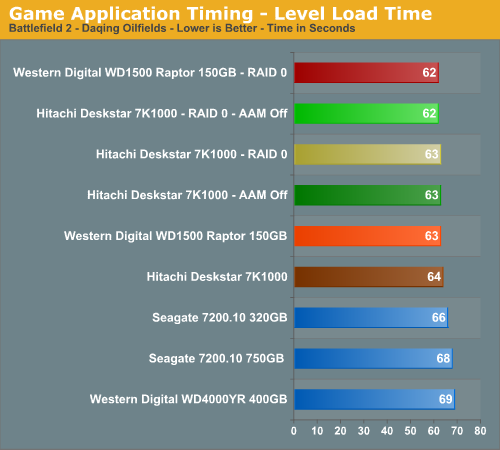
Once again we see a minimal difference between our RAID 0 and single drive configurations in this benchmark with only a one second difference in load times. In repeated testing it was difficult to discern any differences between the RAID 0 and single drive setups. On a side note, we firmly believe the areal density and 32 MB cache advantages of the Hitachi 7K1000 make up for the rotational and random access advantages of the Raptor in our gaming tests.
WinRAR 3.62
Our WinRAR test measures the time it takes to compress our test folder that contains 444 files, 10 folders, and 602MB of data. This is same test folder utilized in our iPeak test suite. This benchmark is extremely CPU/RAM intensive but it may require a fast storage system to keep pace.
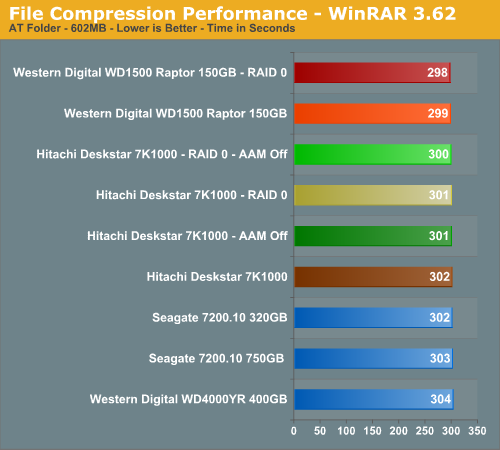
Our iPeak test showed a 50% advantage for the RAID 0 setups but we see an insignificant difference in the actual test results. One would assume the potential write speed advantages of a RAID 0 setup would have a larger impact on performance in this benchmark but in actuality CPU throughput makes a far more significant difference.
Nero Recode
Our encoding test is quite easy - we take our original Office Space DVD and use AnyDVD Ripper to copy the full DVD to the hard drive without compression, thus providing an almost exact duplicate of the DVD. We then fire up Nero Recode 2, select our Office Space copy on the hard drive, and perform a shrink operation to allow the entire movie along with extras to fit on a single 4.5GB DVD disc. We leave all options on their defaults except we turn off the advanced analysis option. The scores reported include the full encoding process and are represented in seconds, with lower numbers indicating better performance.
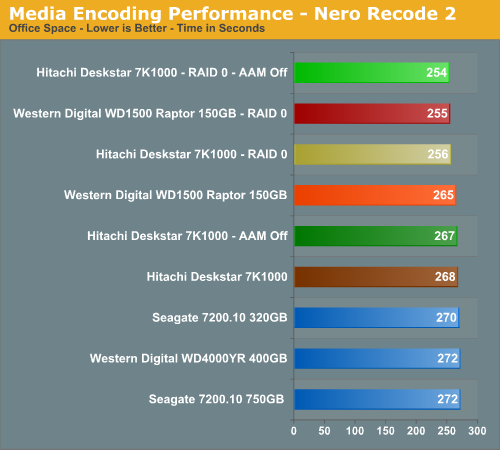
The iPeak results showed a 93% improvement with RAID 0 and we know from previous experience that RAID 0 can make a difference in this particular test. How large the difference would be was anybody's guess, but we figured it was the last chance for RAID 0 to generate any meaningful performance improvements. In the end, we did have measurable differences between the two setups with the RAID 0 configurations performing about 5% better. If you do a lot of video encoding then RAID 0 could end up saving you some precious minutes each day. Is it worth the cost or effort? Probably not, but it is one area besides benchmarking where RAID 0 actually made a difference. Of course, if you don't already have the fastest CPU for encoding available, that would have a far greater impact than RAID 0.
File Copy Performance
Our file copy test measures the time it takes to transfer our test folder that contains 29 files, 1 folder, and transfers 7.55GB of data from our source drive to the target test drive. This is same test folder utilized in our iPeak test suite. This benchmark is disk write intensive and requires a fast storage system.
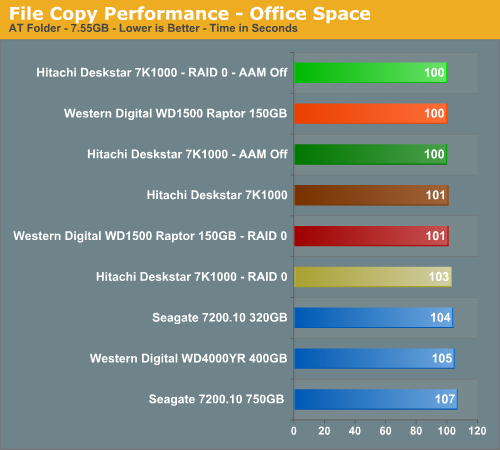
We finish our tests with a benchmark that should have favored the RAID 0 setups due to a pure write scenario. Unlike our iPeak test (and for that matter a similar test in PCMark05) where the largest differences in scores between setups were generated, we have RAID 0 making no difference in this test and actually scoring worse than a single drive setup in two instances.
Our application benchmarks are designed to show application performance results with times being reported in seconds, with lower scores being better. While these tests will show some differences between the drives it is important to understand we are no longer measuring the pure performance of the hard drive but how well our platform performs with each individual drive. In that sense, these are the more real-world tests that show how hard drives and RAID 0 can impact your everyday computer use.
The performance of a hard drive is an integral part of the computer platform but other factors such as memory, CPU, core logic, and even chipset driver choices can play a major role in determining how well the hard drive performs in any given task. Also worth noting is that new features of Windows Vista - specifically SuperFetch - can further reduce the measured performance differences between hard drives.
Game Load Tests
In our Half-Life 2: Lost Coast test we measure the time it takes to load the game with the application timer starting when the play game icon is initiated in the Steam menu until the main game menu appears.
The results speak for themselves with the RAID 0 setups offering extremely minor performance improvements in actual game load testing. You will likely not be able to notice any differences during actual game play with a RAID 0 setup. We know it was impossible for us.
Our Sims 2 - Open for Business test measures the time it takes to load the initial portion of the game. Our application timer starts when the game icon is initiated until the neighborhood menu appears.
We witnessed 38% to 50% improvements in our iPeak tests in this game but measure less than a 2% difference in actual game load times. Without a benchmark, these differences are impossible to witness during actual game play. Once again, we see the Raptors slightly ahead but the 7K1000 for all intents and purposes is even in our game benchmarks.
Game Level Load
This test centers on the actual loading of a playable level within our game selections. We run Battlefield 2 and measure the time it takes to load the Daqing Oilfields level. Our application timer begins when the start single player icon is initiated and ends when the join game icon is visible.
Once again we see a minimal difference between our RAID 0 and single drive configurations in this benchmark with only a one second difference in load times. In repeated testing it was difficult to discern any differences between the RAID 0 and single drive setups. On a side note, we firmly believe the areal density and 32 MB cache advantages of the Hitachi 7K1000 make up for the rotational and random access advantages of the Raptor in our gaming tests.
WinRAR 3.62
Our WinRAR test measures the time it takes to compress our test folder that contains 444 files, 10 folders, and 602MB of data. This is same test folder utilized in our iPeak test suite. This benchmark is extremely CPU/RAM intensive but it may require a fast storage system to keep pace.
Our iPeak test showed a 50% advantage for the RAID 0 setups but we see an insignificant difference in the actual test results. One would assume the potential write speed advantages of a RAID 0 setup would have a larger impact on performance in this benchmark but in actuality CPU throughput makes a far more significant difference.
Nero Recode
Our encoding test is quite easy - we take our original Office Space DVD and use AnyDVD Ripper to copy the full DVD to the hard drive without compression, thus providing an almost exact duplicate of the DVD. We then fire up Nero Recode 2, select our Office Space copy on the hard drive, and perform a shrink operation to allow the entire movie along with extras to fit on a single 4.5GB DVD disc. We leave all options on their defaults except we turn off the advanced analysis option. The scores reported include the full encoding process and are represented in seconds, with lower numbers indicating better performance.
The iPeak results showed a 93% improvement with RAID 0 and we know from previous experience that RAID 0 can make a difference in this particular test. How large the difference would be was anybody's guess, but we figured it was the last chance for RAID 0 to generate any meaningful performance improvements. In the end, we did have measurable differences between the two setups with the RAID 0 configurations performing about 5% better. If you do a lot of video encoding then RAID 0 could end up saving you some precious minutes each day. Is it worth the cost or effort? Probably not, but it is one area besides benchmarking where RAID 0 actually made a difference. Of course, if you don't already have the fastest CPU for encoding available, that would have a far greater impact than RAID 0.
File Copy Performance
Our file copy test measures the time it takes to transfer our test folder that contains 29 files, 1 folder, and transfers 7.55GB of data from our source drive to the target test drive. This is same test folder utilized in our iPeak test suite. This benchmark is disk write intensive and requires a fast storage system.
We finish our tests with a benchmark that should have favored the RAID 0 setups due to a pure write scenario. Unlike our iPeak test (and for that matter a similar test in PCMark05) where the largest differences in scores between setups were generated, we have RAID 0 making no difference in this test and actually scoring worse than a single drive setup in two instances.


48 Comments
View All Comments
Gaelstorm - Wednesday, October 8, 2008 - link
This article was a long time ago, but the second to last comment before mine was talking about fair. If a program is not hard drive intensive and is just slow all around like the Sim 2, you are not being fair by mentioning that Raid 0 doesn't help it. Honestly nothing will help with that games load time except a faster computer overall. Even so that game loads horrible for the type of game it is. I can tell you right now, there are very few situations I have encountered where Raid 0 didn't way outperform a single drive for gaming or just feel on a desktop type system. All the arguing I read, actually made me rethink trusting information from certain sources at all.Per Hansson - Tuesday, April 24, 2007 - link
Some ideas, as could be seen on page 4 of the review the system was limited by something (flat graph in STR instead of what you would expect)This is probably because you are using the normal SCSI Miniport driver, which happens to be the only choice for Win2K and WinXP 32 bit
WinXP 64bit, 2003 Server 32bit and 64 bit and Vista 32 bit and 64 bit has the new StorPort miniport driver, which improves performance tremendeously in RAID arrays
Of course the controller cards driver must also actually support and use the StorPort driver instead of the normal SCSI miniport driver
What this means in laymens terms is that it was not because the "software based" RAID controllers where crap that we got shitty performance in Win2K and XP, it was because those controllers had shitty drivers. Which really was MS fault.
The really expensive RAID controllers however did not use the NT4/2000 Server etc native SCSI miniport driver but had their very own implementation (just as good as MS "all new" storport driver) which meant that they where not capped at about 100-150MB/sec, but rather unlimited... Try your review with 4 150GB Raptors in RAID-0, your performance will be the same because it is the drivers that is holding the system back...
Please keep this in mind for your upcoming review ;)
http://download.microsoft.com/download/5/6/6/5664b...">http://download.microsoft.com/download/...06-45ec-...
ShadowdogKGB - Saturday, April 21, 2007 - link
You have 5 synthetics that tell us that two are faster in stripe but then you have 5 real world tests that aren't real world at all. Tell me who plays HL2 Lost Coast and Sims2 Neighborhood. I think you should just stop testing raid setups all together since you can't be honest about it.Gary Key - Sunday, April 22, 2007 - link
The Sims2 continues to be one of the top selling/played games in the world and HL2 along with its various versions is also a top played title. We are revising our benchmark suite to include WoW and a couple of other titles that were recently released. As far as the other benchmarks, compression/decompression and encoding are fairly common activities on a PC the last time I checked. ;-) What are we not being honest about?
jleboeuf - Saturday, April 21, 2007 - link
I'd be interested to see what your results fair out w/ a raid 10 config w/ 6 drives. that's 3 terabytes, and completely mirroredaethyrmaster - Friday, April 20, 2007 - link
They said they only used a 64 kB (KiB if you prefer) stripe size. Using stripes of 128 kB size would most likely have changed the results significantly. If possible, I'd like to see results with a 256 kB stripe as well.Separately, I personally have used RAID 0, as well as used exactly the same drives in a non-RAID setup. I often times do a lot of transferring of video from my PC to other devices on a Gigabit ethernet network, and the extra 10 to 30 MB/sec transfer rate provided by RAID 0 is well appreciated when you are copying 400 to 800 MB (MiB) of video.
GOSHARKS - Friday, April 20, 2007 - link
Is that even statiscally significant? As it is, it can be slightly misleading.
Gary Key - Sunday, April 22, 2007 - link
Not in the grand scheme of things but the tests were run five different times with the same results. We were providing information based upon having a retail drive to test instead of the OEM drive we had in the first article. There were a few comments that suggested differences could have existed between the two so we tried to answer it.
tshen83 - Thursday, April 19, 2007 - link
reviewing a 1TB drive by raid 0? the writer obviously have NO FREAKING IDEA of what the target audience is. A RAID5 review would be much more appropriate. Hate to lose 100GB of data nowadays...let alone 2TB, at that point, you might as well kill yourselfGary Key - Thursday, April 19, 2007 - link
We have a full RAID article in the works that will test RAID 1, RAID 1+0, and RAID 5 with several drives, Intel and NV chipsets, along with hardware controllers. As I mentioned in the article, this story will be up in the coming weeks. As far as offering RAID 0 results with a motherboard controller chipset, this was done as the vast majority of boutique systems offer this option along with several hundred emails asking when we could provide RAID 0 results with the latest drive releases.