The Intel Broadwell Desktop Review: Core i7-5775C and Core i5-5675C Tested (Part 1)
by Ian Cutress on June 2, 2015 7:45 AM ESTGaming Benchmarks: Mid-Range
Shifting gears, let's take the iGPU out of the equation and look at gaming from a CPU perspective, By moving up to higher-end video cards, we can being to see how Broadwell stacks up in CPU-bound gaming scenarios.
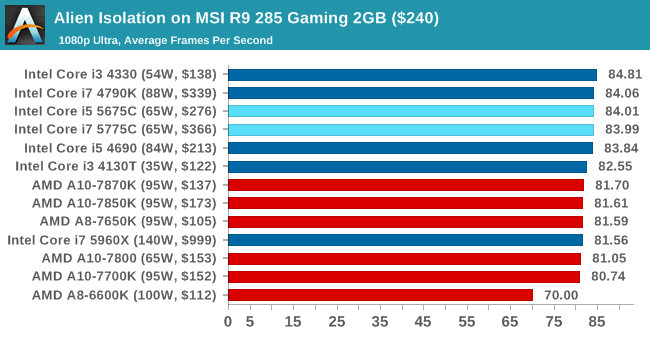
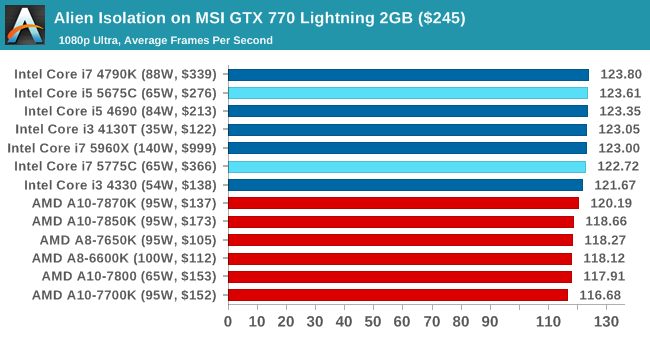
Alien: Isolation
If first person survival mixed with horror is your sort of thing, then Alien: Isolation, based off of the Alien franchise, should be an interesting title. Developed by The Creative Assembly and released in October 2014, Alien: Isolation has won numerous awards from Game Of The Year to several top 10s/25s and Best Horror titles, ratcheting up over a million sales by February 2015. Alien: Isolation uses a custom built engine which includes dynamic sound effects and should be fully multi-core enabled.
For low end graphics, we test at 720p with Ultra settings, whereas for mid and high range graphics we bump this up to 1080p, taking the average frame rate as our marker with a scripted version of the built-in benchmark.

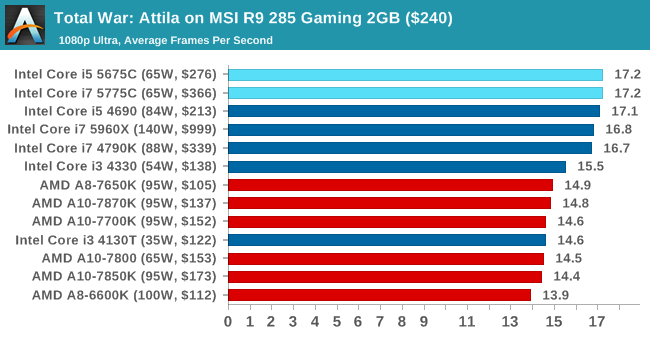
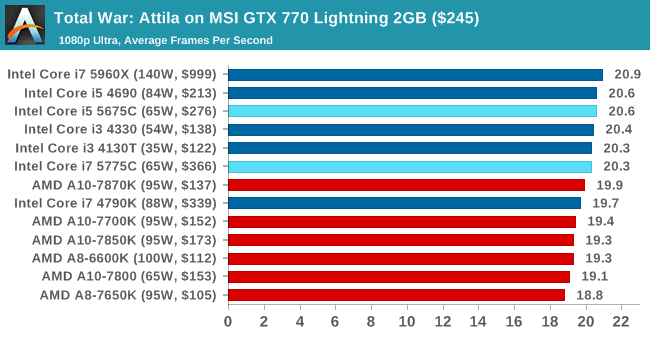
Total War: Attila
The Total War franchise moves on to Attila, another The Creative Assembly development, and is a stand-alone strategy title set in 395AD where the main story line lets the gamer take control of the leader of the Huns in order to conquer parts of the world. Graphically the game can render hundreds/thousands of units on screen at once, all with their individual actions and can put some of the big cards to task.
For low end graphics, we test at 720p with performance settings, recording the average frame rate. With mid and high range graphics, we test at 1080p with the quality setting. In both circumstances, unlimited video memory is enabled and the in-game scripted benchmark is used.

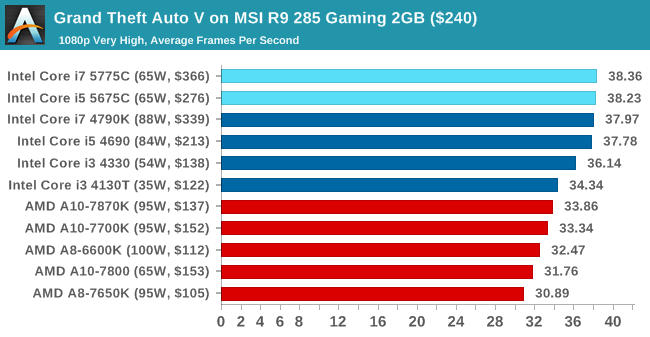
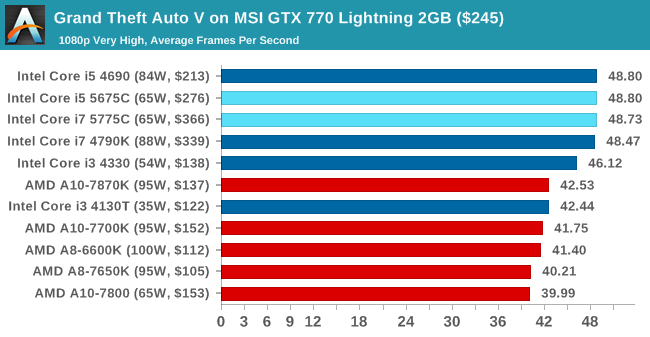
Grand Theft Auto V
The highly anticipated iteration of the Grand Theft Auto franchise finally hit the shelves on April 14th 2015, with both AMD and NVIDIA in tow to help optimize the title. GTA doesn’t provide graphical presets, but opens up the options to users and extends the boundaries by pushing even the hardest systems to the limit using Rockstar’s Advanced Game Engine. Whether the user is flying high in the mountains with long draw distances or dealing with assorted trash in the city, when cranked up to maximum it creates stunning visuals but hard work for both the CPU and the GPU.
For our test we have scripted a version of the in-game benchmark, relying only on the final part which combines a flight scene along with an in-city drive-by followed by a tanker explosion. For low end systems we test at 720p on the lowest settings, whereas mid and high end graphics play at 1080p with very high settings across the board. We record both the average frame rate and the percentage of frames under 60 FPS (16.6ms).

![Grand Theft Auto V on MSI R9 285 Gaming 2GB ($240) [Under 60 FPS]](https://images.anandtech.com/graphs/graph9320/74957.png)
![Grand Theft Auto V on MSI GTX 770 Lightning 2GB ($245) [Under 60 FPS]](https://images.anandtech.com/graphs/graph9320/74967.png)
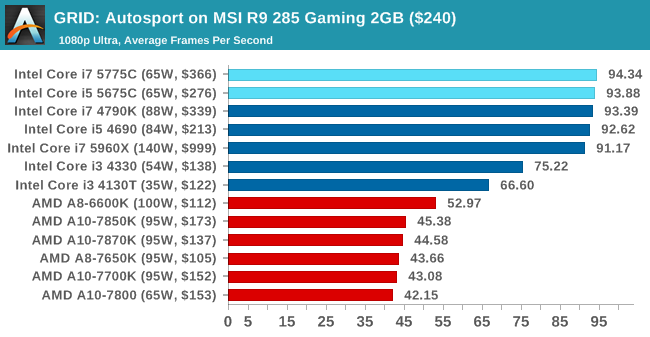
GRID: Autosport
No graphics tests are complete without some input from Codemasters and the EGO engine, which means for this round of testing we point towards GRID: Autosport, the next iteration in the GRID and racing genre. As with our previous racing testing, each update to the engine aims to add in effects, reflections, detail and realism, with Codemasters making ‘authenticity’ a main focal point for this version.
GRID’s benchmark mode is very flexible, and as a result we created a test race using a shortened version of the Red Bull Ring with twelve cars doing two laps. The car is focus starts last and is quite fast, but usually finishes second or third. For low end graphics we test at 1080p medium settings, whereas mid and high end graphics get the full 1080p maximum. Both the average and minimum frame rates are recorded.

![GRID: Autosport on MSI R9 285 Gaming 2GB ($240) [Minimum FPS]](https://images.anandtech.com/graphs/graph9320/74959.png)
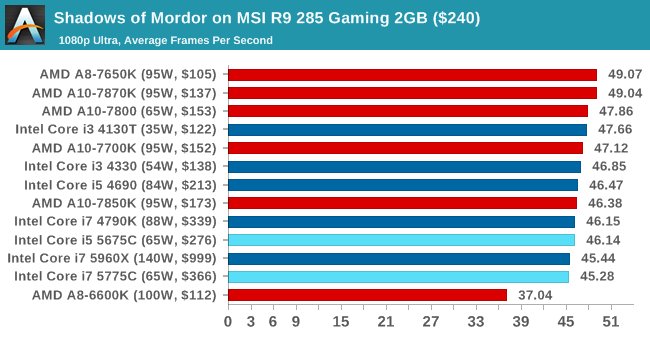
Middle-Earth: Shadows of Mordor
The final title in our testing is another battle of system performance with the open world action-adventure title, Shadows of Mordor. Produced by Monolith using the LithTech Jupiter EX engine and numerous detail add-ons, SoM goes for detail and complexity to a large extent, despite having to be cut down from the original plans. The main story itself was written by the same writer as Red Dead Redemption, and it received Zero Punctuation’s Game of The Year in 2014.
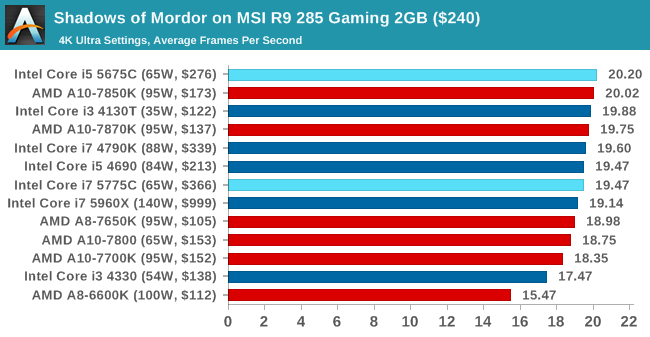
For testing purposes, SoM gives a dynamic screen resolution setting, allowing us to render at high resolutions that are then scaled down to the monitor. As a result, we get several tests using the in-game benchmark. For low end graphics we examine at 720p with low settings, whereas mid and high end graphics get 1080p Ultra. The top graphics test is also redone at 3840x2160, also with Ultra settings, and we also test two cards at 4K where possible.

![Shadows of Mordor on MSI R9 285 Gaming 2GB ($240) [Minimum FPS]](https://images.anandtech.com/graphs/graph9320/74961.png)
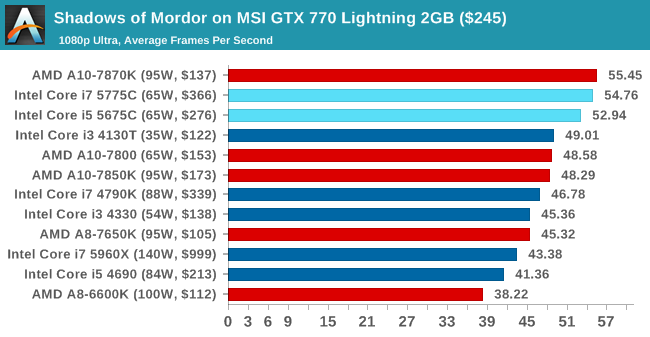
![Shadows of Mordor on MSI GTX 770 Lightning 2GB ($245) [Minimum FPS]](https://images.anandtech.com/graphs/graph9320/74971.png)
Shadows of Mordor at 4K, Single GPU
![Shadows of Mordor on MSI R9 285 Gaming 2GB ($240) [Minimum FPS]](https://images.anandtech.com/graphs/graph9320/74963.png)
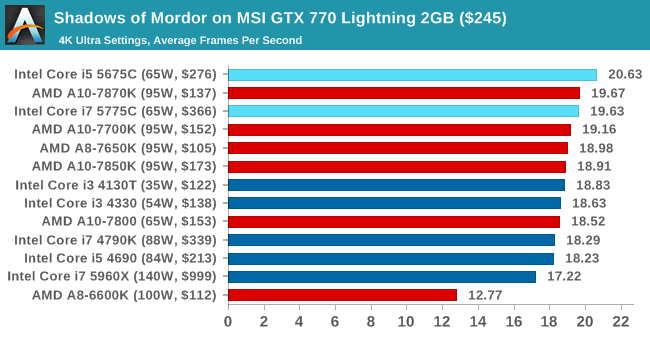
![Shadows of Mordor on MSI GTX 770 Lightning 2GB ($245) [Minimum FPS]](https://images.anandtech.com/graphs/graph9320/74973.png)
Conclusions on Mid-Range Graphics
With the Intel iGPU removed from the picture, what we're seeing here is the combination of Broadwell's architecture improvements, and the Crystal Well eDRAM functioning as an L4 cache for the CPU cores. The biggest benefit here Broadwell-DT was with the R9 285 for GRID on minimum frame rates, showing 75.6 for the 4790K vs 80.06 for the 5775C. Otherwise performance overall is not all that different from what we already see with the best Haswell CPUs, however it's a bit surprising that the Broadwell CPUs don't fall behind, given their rather sizable frequency deficit versus the i7-4790K.


196 Comments
View All Comments
nandnandnand - Tuesday, June 2, 2015 - link
A10-7870K is listed as $137 and A10-7850K as $173Ian Cutress - Tuesday, June 2, 2015 - link
$137 is the launch price of the A10-7870K.$173 was the launch price of the A10-7850K.
We mentioned why we do launch pricing in our graphs in previous reviews, but it comes down to our graphs not being dynamically linked to a retailer and we have to pick a point that's suitable over time. Launch pricing does that, even though there might be future discounts over time.
nandnandnand - Tuesday, June 2, 2015 - link
Ok, that makes sense.Business opportunity: add a drop down to switch from launch price to "live price" for Newegg/Amazon/etc., hyperlink live prices, get a cut from every click.
AS118 - Saturday, June 6, 2015 - link
I agree with nand. Other sites do this, and it's helpful to me because I often read reviews to make a purchase anyway, and it helps me see what the price is right now.FlushedBubblyJock - Sunday, June 14, 2015 - link
Take a look at how much the GTX980 stomps the amd 290X above - in the review here where they aren't concerned and paying attention and picking the best games for amd gimpy hardware.Just look at the FPS difference... let it sin in - the reviewers haphazardly reveal the truth when they are not intending to.
bloodroses75 - Wednesday, June 17, 2015 - link
Oh look, a current gen video card beat a last gen card that is just over half the price.You may want to try waiting until the 300 series is released/ bench marked before spouting how superior one is over the other. If the 300 series ends up being a dud (which it kinda looks like it will), so be it; at least it will be an 'apple to apple' comparison.
MrSpadge - Tuesday, June 2, 2015 - link
You don't need dynamically updated prices. simply pick the prices around the release date of the new hardware. If the price of a 1 or 2 years old comparison chip was lowered significantly (yes, this still happens sometimes), comparing it based on launch price is misleading and will always make some people shout "unfair". You easily fix this.taltamir - Tuesday, June 9, 2015 - link
I agree, the obvious thing to do is use the price as it is during the time the article was written.That means launch price for the item being reviewed and current prices for all items it is being compared to
ImSpartacus - Tuesday, June 2, 2015 - link
Since you have to do a "snapshot" pricing for these reviews, you may want to consider looking at average pricing at the time of review. At least then the time frame for each snap shot is the same.nathanddrews - Tuesday, June 2, 2015 - link
There's a fine line between "just enough" information and "too much". Prices for CPUs vary greatly depending on where you buy them.