Mushkin Reactor 1TB SSD Review
by Kristian Vättö on February 9, 2015 11:32 AM EST- Posted in
- Storage
- SSDs
- Mushkin
- Silicon Motion
- SM2246EN
- Reactor
- Micron 16nm
AnandTech Storage Bench 2013
Our Storage Bench 2013 focuses on worst-case multitasking and IO consistency. Similar to our earlier Storage Benches, the test is still application trace based – we record all IO requests made to a test system and play them back on the drive we are testing and run statistical analysis on the drive's responses. There are 49.8 million IO operations in total with 1583.0GB of reads and 875.6GB of writes. I'm not including the full description of the test for better readability, so make sure to read our Storage Bench 2013 introduction for the full details.
| AnandTech Storage Bench 2013 - The Destroyer | ||
| Workload | Description | Applications Used |
| Photo Sync/Editing | Import images, edit, export | Adobe Photoshop CS6, Adobe Lightroom 4, Dropbox |
| Gaming | Download/install games, play games | Steam, Deus Ex, Skyrim, Starcraft 2, BioShock Infinite |
| Virtualization | Run/manage VM, use general apps inside VM | VirtualBox |
| General Productivity | Browse the web, manage local email, copy files, encrypt/decrypt files, backup system, download content, virus/malware scan | Chrome, IE10, Outlook, Windows 8, AxCrypt, uTorrent, AdAware |
| Video Playback | Copy and watch movies | Windows 8 |
| Application Development | Compile projects, check out code, download code samples | Visual Studio 2012 |
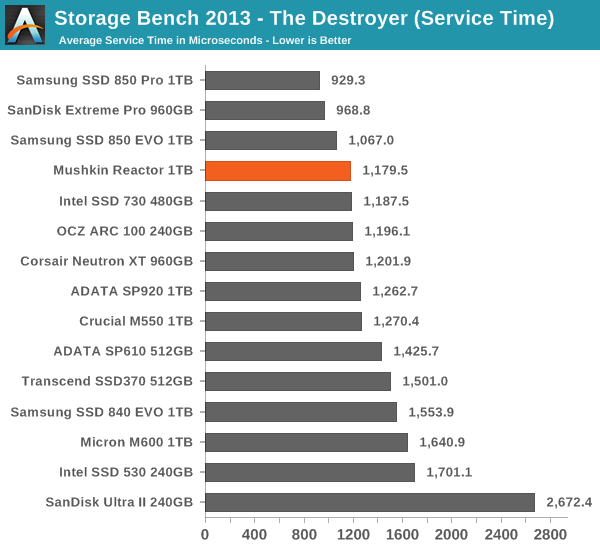
We are reporting two primary metrics with the Destroyer: average data rate in MB/s and average service time in microseconds. The former gives you an idea of the throughput of the drive during the time that it was running the test workload. This can be a very good indication of overall performance. What average data rate doesn't do a good job of is taking into account response time of very bursty (read: high queue depth) IO. By reporting average service time we heavily weigh latency for queued IOs. You'll note that this is a metric we have been reporting in our enterprise benchmarks for a while now. With the client tests maturing, the time was right for a little convergence.
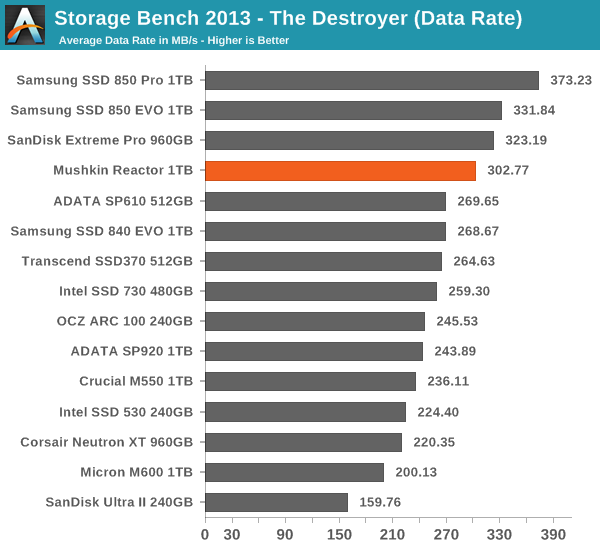
The Reactor does very well in our 2013 Storage Bench and is only beaten by the more expensive SanDisk and Samsung. Among the more value-oriented 1TB SSDs, the Reactor seems to be taking the lead.


69 Comments
View All Comments
prime2515103 - Monday, February 9, 2015 - link
Is it just me or are SSD review getting really boring? Every time I see a new one I think, "Maybe something new and exciting this time..." but it never happens. I think SATA needs to be put to rest.piroroadkill - Monday, February 9, 2015 - link
Yeah, SATA3 is making everything boring as hell now.ddriver - Monday, February 9, 2015 - link
That's a limiting factor only on sequential access. There is still huge potential to be harnessed for random access, but nobody seems to be in a hurry to boost IOPS.Kristian Vättö - Monday, February 9, 2015 - link
SATA, or more accurately AHCI, is the limit when it comes to IOPS/latency.cm2187 - Friday, February 13, 2015 - link
I can only talk for myself but personally I could use more size than speed. There is very little of what I do that would give me a different experience at twice the speed of the current SSD specs. But give me a 4TB SSD as cheap as 6TB HDD are today and now I can replace all these spinning disks.0ldman79 - Wednesday, March 4, 2015 - link
Agreed.I might keep a couple of mechanical drives, but I'd love for the price to be closer to the mechanical drives for the capacity.
Too bad that's not the way our market works in much of anything these days.
Solandri - Monday, February 9, 2015 - link
PCIe actually doesn't make that big a difference. Your perception of how fast/slow things are is in terms of seconds you have to wait. These benchmarks are in MB/s which is the inverse of your perception. If you plot these benchmarks correctly in sec/MB, all these SSDs are pretty much the same, and the PCIe SSDs only give you a small fraction of the speedup you got going from SATA2 to SATA3. e.g. Imagine you need to read 1000 MB.10 sec = 100 MB/s HDD
4 sec = 250 MB/s SATA2 SSD (6 sec improvement)
2 sec = 500 MB/s SATA 3 SSD (2 sec improvement)
1.25 sec = 800 MB/s PCIe SSD (0.75 sec improvement)
nathanddrews - Monday, February 9, 2015 - link
This is very true, but doesn't make me want it less. :-DWhat kills me is the lack of "affordable" 2TB+ drives. How is that we go from $400 for 1TB in a 2.5" drive to $1,500-$4,000 for 2TB? I expected that all these die shrinks and 3D technologies would have made 2TB+ SSDs possible in the ~$700-$900 space, but there's nothing to buy! FFS, what gives?
DanNeely - Monday, February 9, 2015 - link
It's a giant game of chicken, and no one wants to be the first to kick over the enterprisy pricing gravy train. We saw the same thing a few years ago when 512TB drives started at $350 but the cheapest 1TB ones were well north of $1k.At the risk of sounding overly cynical; I suspect the first vendor to blink will be whoever is first to either get the higher nand density or the 32 chip controller needed to make a 4TB flash drive in a 2.5" form factor.
Cogman - Monday, February 9, 2015 - link
Mostly it comes down to demand. Nobody is really demanding 2TB SSD drives. As a result, there is little competition and little incentive to make a $800 drive (even though it is totally feasible).