Intel Haswell-EP Xeon 12 Core Review: E5-2650L V3 and E5-2690 V3
by Ian Cutress on November 6, 2014 9:00 AM EST- Posted in
- CPUs
- IT Computing
- Intel
- Xeon
- Enterprise
- LGA2011-3
- Haswell EP
Gaming Benchmarks
While the last thought on the minds of most Xeon users is related to gaming, we frequently get requests to test gaming performance on Xeons. As a result we strap the Xeon to a regular consumer level motherboard that can support them and add in one or two GPUs to see how they perform and if more cores makes a difference over the drop in frequency. Unfortunately due to the orientation of the PCIe slots on the 2P board, we were unable to test the dual E5-2650L v3 configuration.
F1 2013
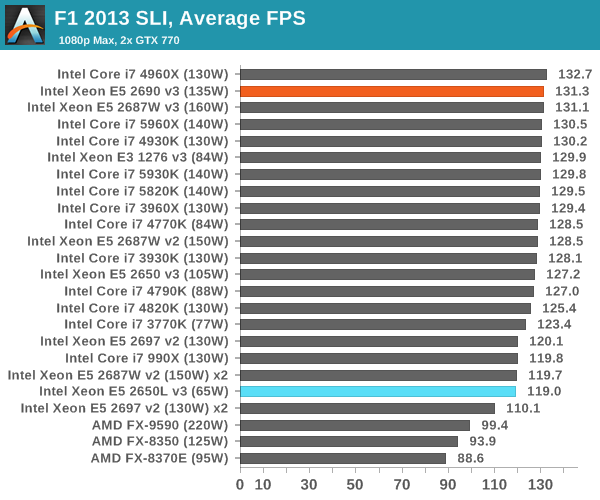
First up is F1 2013 by Codemasters. I am a big Formula 1 fan in my spare time, and nothing makes me happier than carving up the field in a Caterham, waving to the Red Bulls as I drive by (because I play on easy and take shortcuts). F1 2013 uses the EGO Engine, and like other Codemasters games ends up being very playable on old hardware quite easily. In order to beef up the benchmark a bit, we devised the following scenario for the benchmark mode: one lap of Spa-Francorchamps in the heavy wet, the benchmark follows Jenson Button in the McLaren who starts on the grid in 22nd place, with the field made up of 11 Williams cars, 5 Marussia and 5 Caterham in that order. This puts emphasis on the CPU to handle the AI in the wet, and allows for a good amount of overtaking during the automated benchmark. We test at 1920x1080 on Ultra graphical settings.
Bioshock Infinite
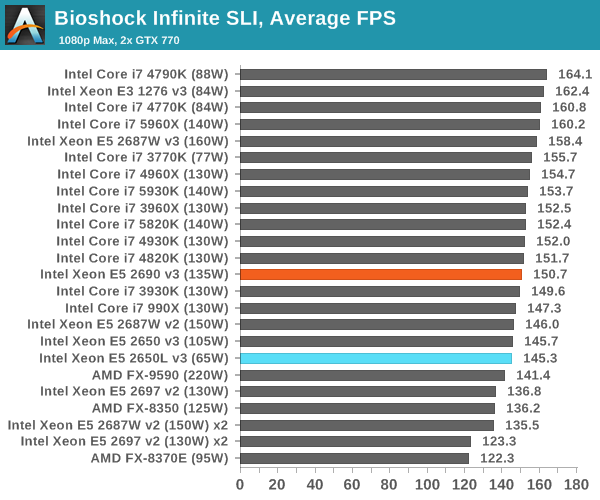
Bioshock Infinite was Zero Punctuation’s Game of the Year for 2013, uses the Unreal Engine 3, and is designed to scale with both cores and graphical prowess. We test the benchmark using the Adrenaline benchmark tool and the Xtreme (1920x1080, Maximum) performance setting, noting down the average frame rates and the minimum frame rates.
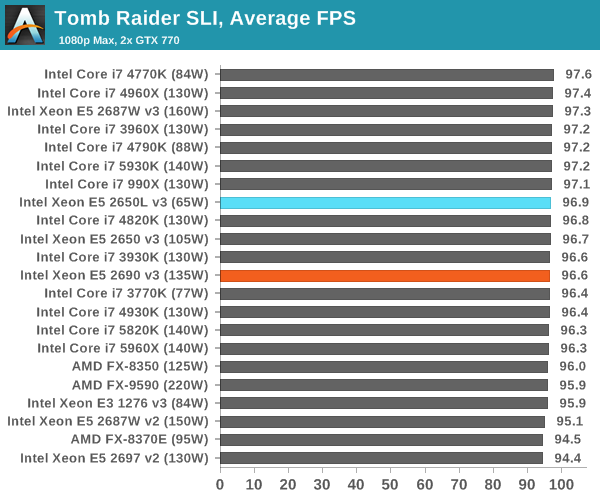
Tomb Raider
The next benchmark in our test is Tomb Raider. Tomb Raider is an AMD optimized game, lauded for its use of TressFX creating dynamic hair to increase the immersion in game. Tomb Raider uses a modified version of the Crystal Engine, and enjoys raw horsepower. We test the benchmark using the Adrenaline benchmark tool and the Xtreme (1920x1080, Maximum) performance setting, noting down the average frame rates and the minimum frame rates.

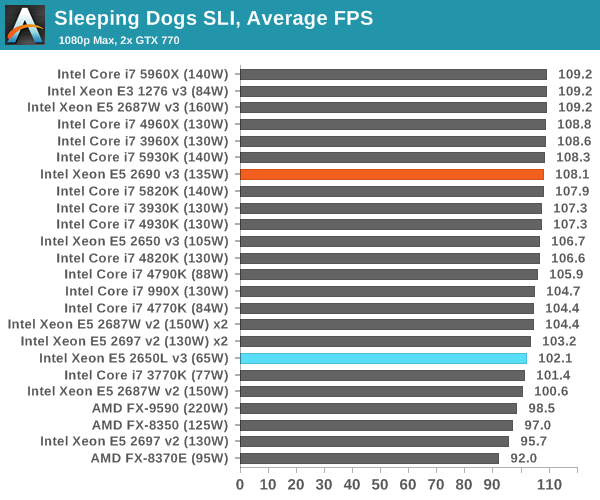
Sleeping Dogs
Sleeping Dogs is a benchmarking wet dream – a highly complex benchmark that can bring the toughest setup and high resolutions down into single figures. Having an extreme SSAO setting can do that, but at the right settings Sleeping Dogs is highly playable and enjoyable. We run the basic benchmark program laid out in the Adrenaline benchmark tool, and the Xtreme (1920x1080, Maximum) performance setting, noting down the average frame rates and the minimum frame rates.

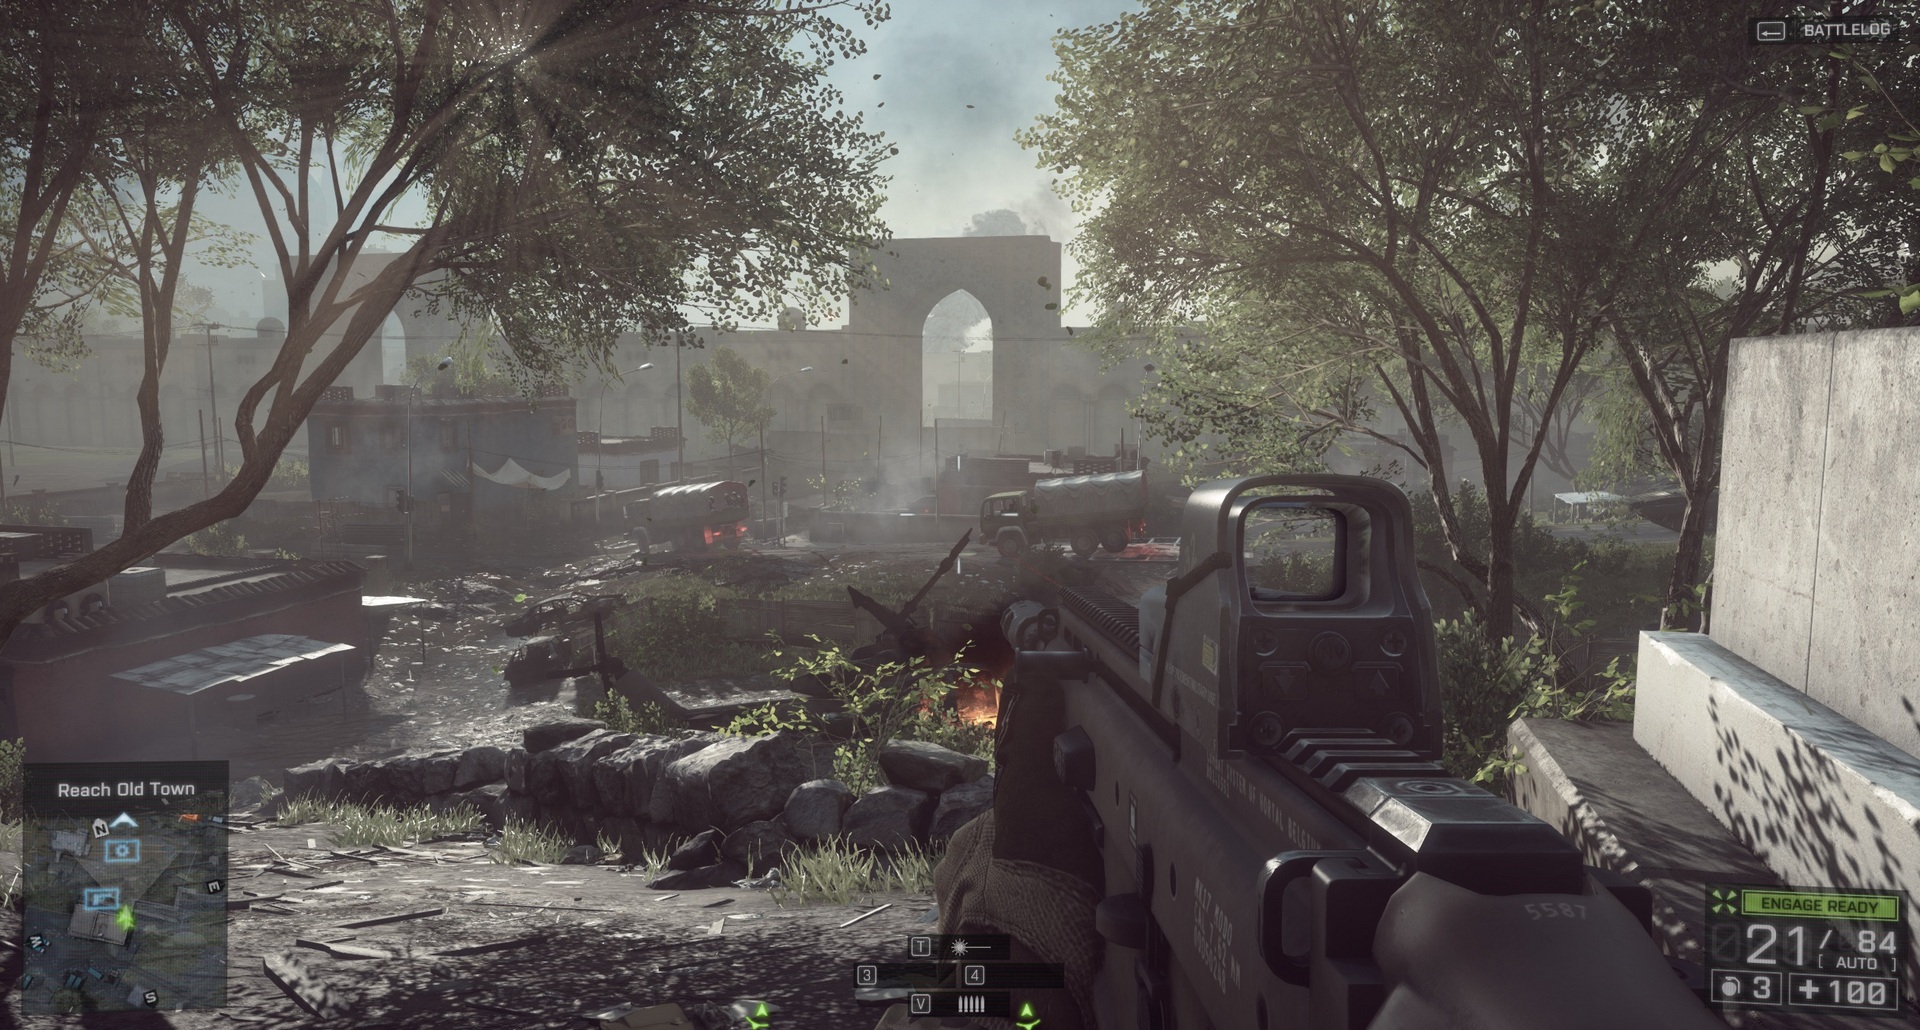
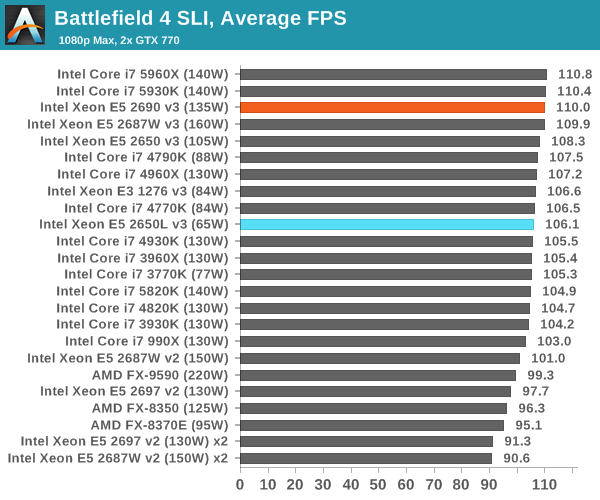
Battlefield 4
The EA/DICE series that has taken countless hours of my life away is back for another iteration, using the Frostbite 3 engine. AMD is also piling its resources into BF4 with the new Mantle API for developers, designed to cut the time required for the CPU to dispatch commands to the graphical sub-system. For our test we use the in-game benchmarking tools and record the frame time for the first ~70 seconds of the Tashgar single player mission, which is an on-rails generation of and rendering of objects and textures. We test at 1920x1080 at Ultra settings.


52 Comments
View All Comments
XZerg - Thursday, November 6, 2014 - link
I really dislike the Power Consumpution Delta chart. Could you please go back to separate Idle chart and Load chart?Mikemk - Thursday, November 6, 2014 - link
+1klagermkii - Thursday, November 6, 2014 - link
I don't understand the purpose of that chart. It leaves too much ambiguity between CPUs that are efficient at load vs CPUs that just have poor idle power management.ziorus - Thursday, November 6, 2014 - link
100% agree with XZerg. I was coming to this site because you had the idle and load charts. Those two infos really are needed. Not this delta chart. We do not even know where power consumption in watts at idle starts to add in the numbers.Guspaz - Thursday, November 6, 2014 - link
Agreed. The delta is basically useless information, because it gives a CPU with a power range of 10W-20W and a CPU with a power range of 100W-110W the same score, and tells us nothing about how much power the part actually draws (so we can't use the info to size PSUs) or how much heat it might produce (so we can't use the info to size cooling).The delta is, without the idle/load, completely meaningless.
Schafdog - Thursday, November 6, 2014 - link
I want to join the club to complain on only one (delta) power measurement. Idle is important. Max is important.MrCommunistGen - Saturday, November 8, 2014 - link
I think that the Delta chart is designed to give an apples to apples comparison of how much power the CPU itself consumes under load. The platforms of all of those systems are vastly different. There's a range of motherboards from single socket consumer IVB to dual socket workstation/server Haswell and everything in between. While a comparison of raw platform power under idle and load certainly bears its own merit and and represents an interesting set of figures, it does not provide a meaningful comparison for the subject of this article - a CPU.Delta power allows for all kinds of comparisons. Regardless of motherboard, RAM, etc you can establish that a given CPU will use (approximately) X number of watts under load. If you then provide performance figures for that load, you can get the compute efficiency of the CPU. In big data clusters, especially ones that primarily perform a specific workload this is an important figure.
0ldman79 - Monday, November 10, 2014 - link
Delta chart is fine. We still want to see idle and max load.Call me old fashioned.
danjw - Thursday, November 6, 2014 - link
First paragraph in "Market" "bandwidth contained applications" should be "bandwidth constrained applications", I think.rocketscience315 - Thursday, November 6, 2014 - link
Um, isn't the Frequency Response graph missing the 2648L?