GIGABYTE AM1M-S2H Review: What Can $35 Get You?
by Ian Cutress on August 15, 2014 3:00 PM EST- Posted in
- Motherboards
- AMD
- Gigabyte
- Kabini
- AM1
GIGABYTE AM1M-S2H In The Box
Despite all the talk earlier in the review about how low cost motherboards and the motherboard manufacturers are dealing with extremely low margins, imagine developing a motherboard for that budget then being told that some extras have to be put into the box. Now I admit the usual extras we get in the box (SATA cables, IO shield) are bought in immense bulk, but even these have a tangible bill-of-materials cost, even if it comes in at a few cents each. If one SATA cable cost 3.5 cents, that is 0.1% of the cost – double if two are added. I suspect that the thick, multi-language manuals cost north of $0.50 each to produce as well, so this might be stripped down to compensate. When margins are quibbling over cents, we should not expect many extras.
In the AM1M-S2H, we get the following:
Manual
Driver Disk
Rear IO Shield
Two SATA Cables
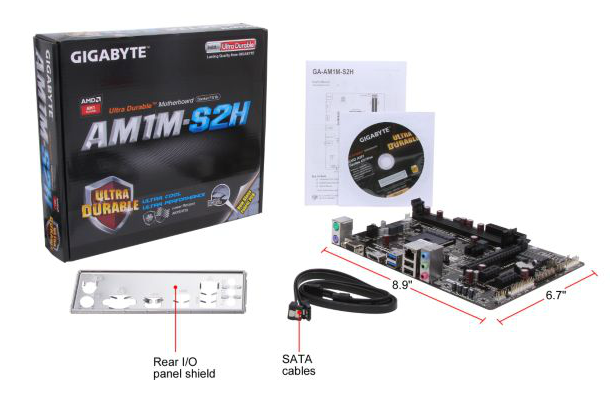
As expected, not much but enough to get a user started if purchasing OEM storage/ODD.
Many thanks to...
We must thank the following companies for kindly providing hardware for our test bed:
Thank you to OCZ for providing us with PSUs and SSDs.
Thank you to G.Skill for providing us with memory.
Thank you to Corsair for providing us with an AX1200i PSU and a Corsair H80i CLC.
Thank you to MSI for providing us with the NVIDIA GTX 770 Lightning GPUs.
Thank you to Rosewill for providing us with PSUs and RK-9100 keyboards.
Thank you to ASRock for providing us with some IO testing kit.
Test Setup
| Test Setup | |
| Processor |
AMD Athlon 5350 Quad Core, 2.05 GHz |
| Motherboards | GIGABYTE AM1M-S2H |
| Cooling | Stock Cooler |
| Power Supply | OCZ 1250W 80 PLUS Gold |
| Memory | ADATA XPG V1.0 2x8GB DDR3L-1600 9-11-9 |
| Memory Settings | XMP |
| Video Cards | MSI GTX 770 Lightning |
| Video Drivers | NVIDIA 337.88 |
| Hard Drive | OCZ Vertex 3 240 GB |
| Case | Open Test Bed |
| Operating System | Windows 7 64-bit SP1 |
| USB 2/3 Testing | OCZ Vertex 3 240 GB |
System Benchmarks
Power Consumption
Power consumption was tested on the system while in a single MSI GTX 770 Lightning GPU configuration with a wall meter connected to the OCZ 1250W power supply. This power supply is Gold rated, and as I am in the UK on a 230-240 V supply, leads to ~75% efficiency > 50W, and 90%+ efficiency at 250W, suitable for both idle and multi-GPU loading. This method of power reading allows us to compare the power management of the UEFI and the board to supply components with power under load, and includes typical PSU losses due to efficiency. These are the real world values that consumers may expect from a typical system (minus the monitor) using this motherboard.
While this method for power measurement may not be ideal, and you feel these numbers are not representative due to the high wattage power supply being used (we use the same PSU to remain consistent over a series of reviews, and the fact that some boards on our test bed get tested with three or four high powered GPUs), the important point to take away is the relationship between the numbers. These boards are all under the same conditions, and thus the differences between them should be easy to spot.
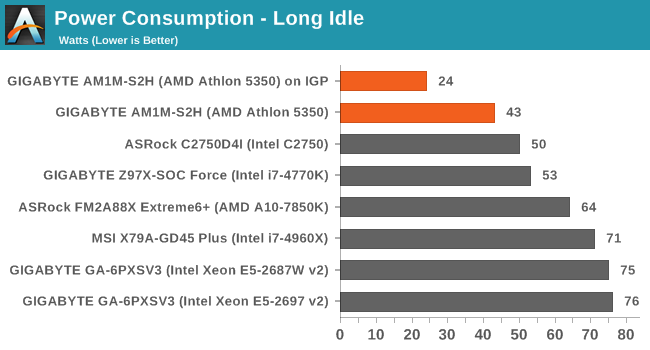
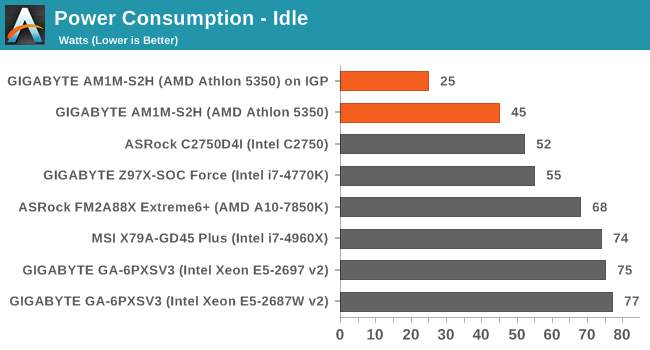
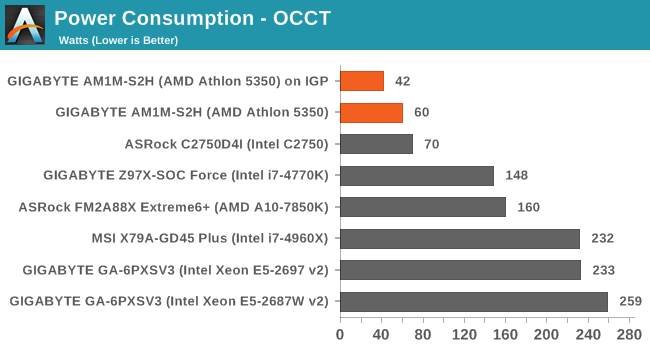
Being at the low end of the efficiency bell curve rockets our power consumption numbers, but for comparison to other platforms we have to remain consistent. Nevertheless, at full CPU load the increase in power consumption is only 17-18W. Perhaps surprisingly is the extra power consumption with the GPU installed.
Windows 7 POST Time
Different motherboards have different POST sequences before an operating system is initialized. A lot of this is dependent on the board itself, and POST boot time is determined by the controllers on board (and the sequence of how those extras are organized). As part of our testing, we look at the POST Boot Time using a stopwatch. This is the time from pressing the ON button on the computer to when Windows 7 starts loading. (We discount Windows loading as it is highly variable given Windows specific features.)
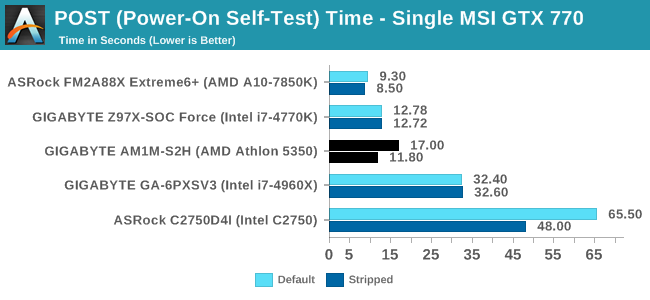
Low cost platforms are not targets for POST Time optimization, so anything under 20 seconds should be reasonable. The lack of controllers on low cost platforms should help POST times in that regard as well.
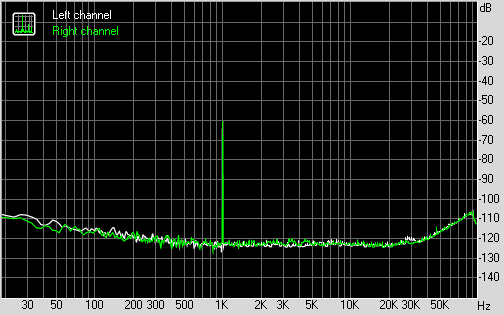
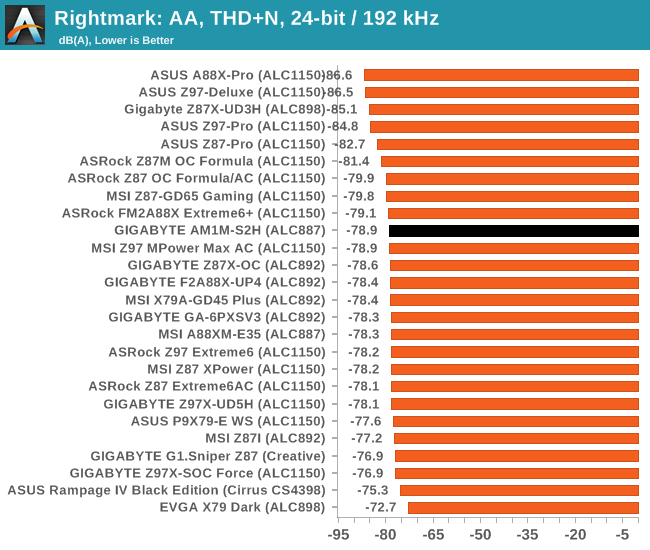
Rightmark Audio Analyzer 6.2.5
Rightmark:AA indicates how well the sound system is built and isolated from electrical interference (either internally or externally). For this test we connect the Line Out to the Line In using a short six inch 3.5mm to 3.5mm high-quality jack, turn the OS speaker volume to 100%, and run the Rightmark default test suite at 192 kHz, 24-bit. The OS is tuned to 192 kHz/24-bit input and output, and the Line-In volume is adjusted until we have the best RMAA value in the mini-pretest. We look specifically at the Dynamic Range of the audio codec used on board, as well as the Total Harmonic Distortion + Noise.
Dynamic Range of AM1M-S2H
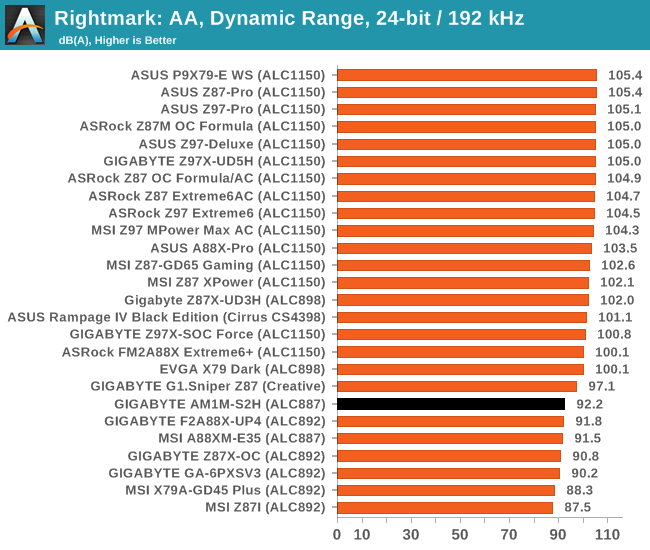
92.2 dBA is pretty much ball-park for an ALC887.
USB Backup
For this benchmark, we transfer a set size of files from the SSD to the USB drive using DiskBench, which monitors the time taken to transfer. The files transferred are a 1.52 GB set of 2867 files across 320 folders – 95% of these files are small typical website files, and the rest (90% of the size) are small 30 second HD videos. In an update to pre-Z87 testing, we also run MaxCPU to load up one of the threads during the test which improves general performance up to 15% by causing all the internal pathways to run at full speed.
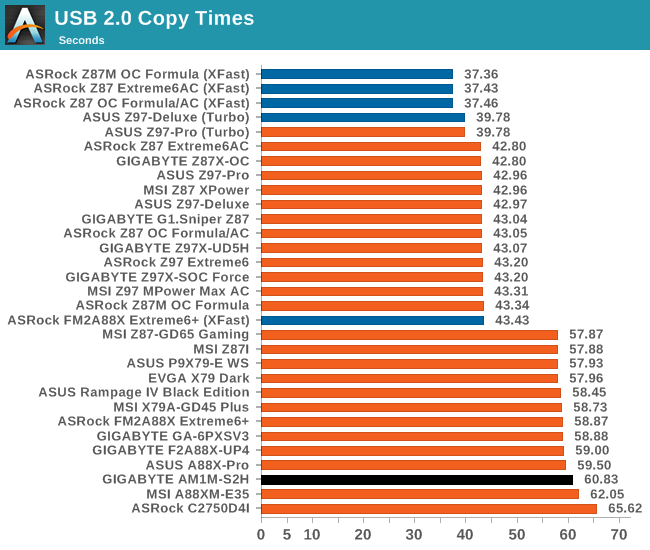
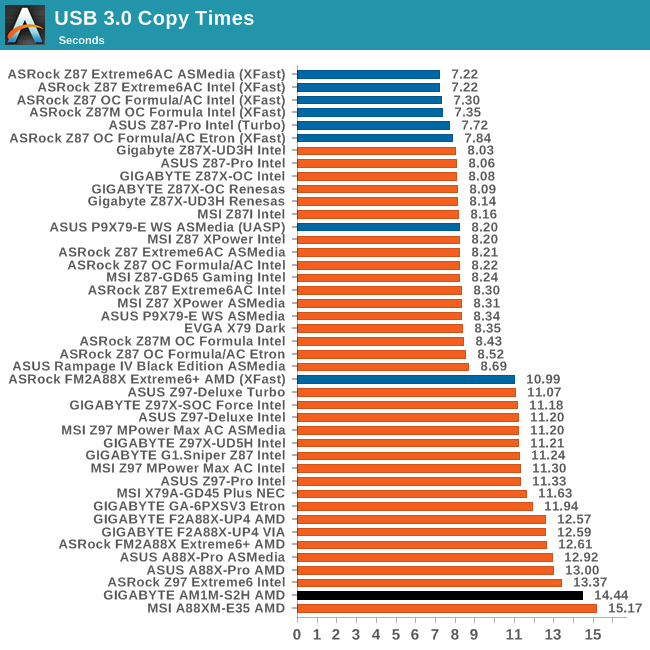
One would imagine that USB speed should be constant across any platform, especially when the standard used and base frequencies for the pathways are the same. We have seen in the past that the CPU used can have a difference in USB copy times, as well as the memory, but we try and negate that by loading up one thread during the test. For USB copy times the AM1 platform, while slower than the rest, does not perform too badly overall.
DPC Latency
Deferred Procedure Call latency is a way in which Windows handles interrupt servicing. In order to wait for a processor to acknowledge the request, the system will queue all interrupt requests by priority. Critical interrupts will be handled as soon as possible, whereas lesser priority requests such as audio will be further down the line. If the audio device requires data, it will have to wait until the request is processed before the buffer is filled.
If the device drivers of higher priority components in a system are poorly implemented, this can cause delays in request scheduling and process time. This can lead to an empty audio buffer and characteristic audible pauses, pops and clicks. The DPC latency checker measures how much time is taken processing DPCs from driver invocation. The lower the value will result in better audio transfer at smaller buffer sizes. Results are measured in microseconds.
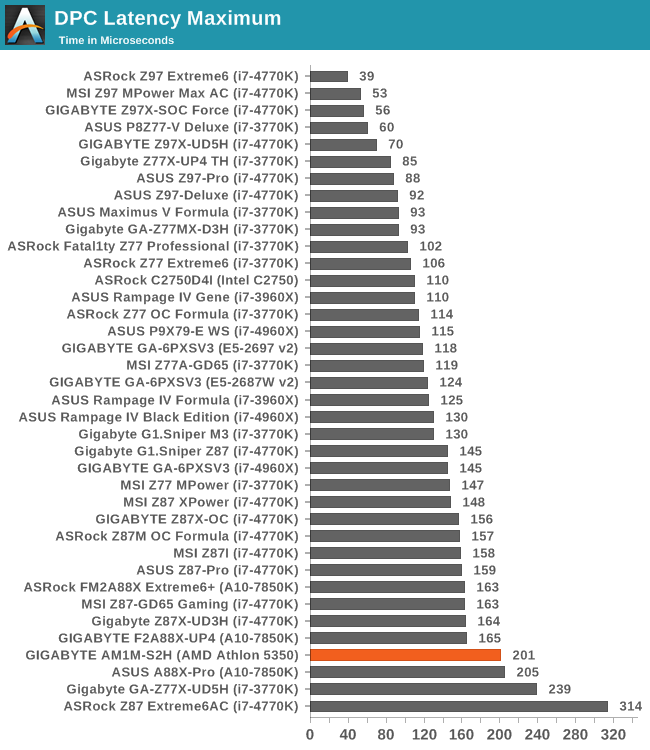
One of the good things about DPC Latency is that it seems to have become a generational improvement rather than one relying on a fast platform. It seems that the newer the platform in general, the better the DPC Latency. While 201 microseconds is on that 200 boundary we like to distinguish at the high end, compared to some bad results we have had in the past, this is great.


45 Comments
View All Comments
Flunk - Friday, August 15, 2014 - link
I'm confused as to why this needs an ATX 4-pin connector at all, they were introduced to provide more power to power-hungry CPUs. This doesn't need much power on the CPU socket so it seems unnecessary.It would also have been nice to see the gaming results with the IGP, most of these boards are going to be utilized with the IGP.
Considering the price of this platform the performance seems really great, I think I would recommend something like this to people who just want a very basic desktop system.
TerdFerguson - Friday, August 15, 2014 - link
This looks great, although I insist that the possibility of a $35 functional motherboard is far less astonishing than the possibility of a $200+ motherboard. Yet again, I challenge any honest, authoritative source to break down the build cost of a "high end" motherboard.StrangerGuy - Friday, August 15, 2014 - link
Every industry tries to rip people off as much as they could get away with it...Why would mobos be any different? Most people don't need more than a $50 even for gaming purposes, let alone $100+.Lonyo - Saturday, August 16, 2014 - link
The cost of a product is more than just the bill of materials.kmmatney - Friday, August 15, 2014 - link
Maybe it cheaper to give the cpu it's own power, than routing it from the main connector? I'm sure every decision on this motherboard had cost in mind.DanNeely - Friday, August 15, 2014 - link
Probably to feed the GPU slot if someone puts a card with a decent power draw. The 24pin connector dates back to when 3.3/5V were used to power most of the mobo and only has 2 12V wires.MikeMurphy - Sunday, August 17, 2014 - link
Because when you plug in a 75w PCIe card you need all the power you can get.You make good points on the 770 but I think the point was to show which apps are CPU limited. The 5350 IGP is already well documented.
wrkingclass_hero - Friday, August 15, 2014 - link
0.0 dat power supply...Daniel Egger - Friday, August 15, 2014 - link
The selection of comparison points is rather strange, why compare power consumption of completely different aimed Intel systems (Servers, Top End of Halswells and an Atom?) rather than a Haswell Celeron or low end i3 while the benchmarks have a completely different and partially also much larger set of systems.ozzuneoj86 - Friday, August 15, 2014 - link
It seems like this happens a lot, and there are usually reasons for it, such as a lack of hardware to test on or time constraints, but if the results don't really tell us anything in the end, it is a bit frustrating. I think I said this the last time we had a Kabini review. Basically, the results often only show us that the CPU is slower than far more expensive systems, and that the AM1 CPUs increase slightly in performance as the price goes up... exactly as you'd expect. We get very little in the way of comparison between competing products, or even between old and new products. I really hope Anandtech will start supplying the reviewers with some more low end platforms if we're going to keep getting reviews like this. I just feel kind of bad for the writers of these nice reviews when the readers walk away from a review in the end not really having any more information about how the product compares to similarly priced options, slightly more expensive options, or older options that they might be able to get cheaper. They can only run tests with hardware that is available to them... and clearly there's a lack of entry-level hardware available to the guys here. I'm sure someone would be willing to donate some stuff to make these reviews more helpful. We need some comparisons with ivy and sandy bridge celeron (847, 1037u), older APUs (E350, A4 3xxx), Haswell celeron (G1830), older Athlons (X2, II X2, X2 e low power chips), Core 2 (E4300, E8400) and 771 Xeons (like the L5240, L5420, since they can be had for cheap now and modded to 775). These are the options I think of when I think of systems like Kabini, and they are for the most part nowhere to be seen in these reviews.