AMD’s 5 GHz Turbo CPU in Retail: The FX-9590 and ASRock 990FX Extreme9 Review
by Ian Cutress on August 9, 2014 8:00 AM ESTCPU Benchmarks: Comparing Motherboards
Readers of our motherboard review section will have noted the trend in modern motherboards to implement a form of MultiCore Enhancement / Acceleration / Turbo (read our report here) on their motherboards. This does several things – better benchmark results at stock settings (not entirely needed if overclocking is an end-user goal), at the expense of heat and temperature, but also gives in essence an automatic overclock which may be against what the user wants. Our testing methodology is ‘out-of-the-box’, with the latest public BIOS installed and XMP enabled, and thus subject to the whims of this feature. It is ultimately up to the motherboard manufacturer to take this risk – and manufacturers taking risks in the setup is something they do on every product (think C-state settings, USB priority, DPC Latency / monitoring priority, memory subtimings at JEDEC). Processor speed change is part of that risk which is clearly visible, and ultimately if no overclocking is planned, some motherboards will affect how fast that shiny new processor goes and can be an important factor in the purchase.
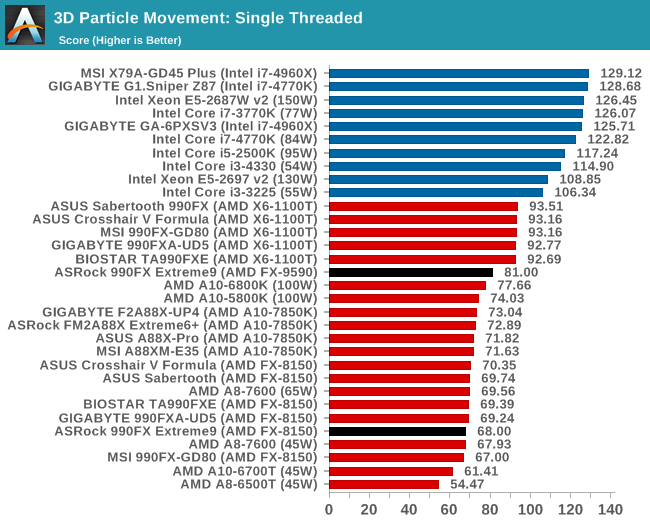
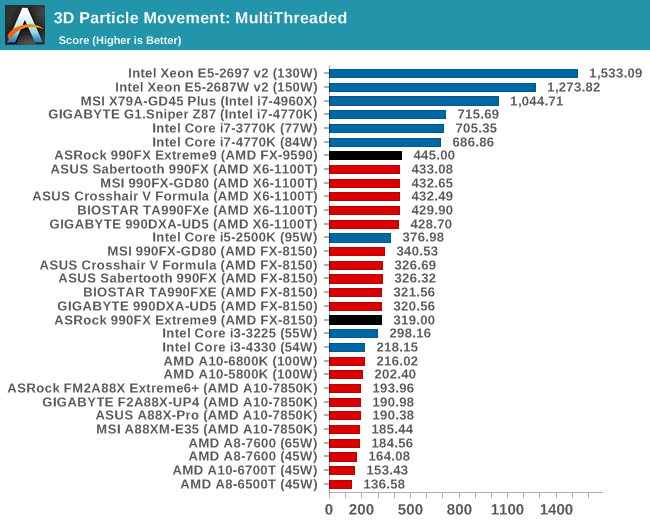
Point Calculations – 3D Movement Algorithm Test: link
3DPM is a self-penned benchmark, taking basic 3D movement algorithms used in Brownian Motion simulations and testing them for speed. High floating point performance, MHz and IPC wins in the single thread version, whereas the multithread version has to handle the threads and loves more cores.
Compression – WinRAR 5.0.1: link
Our WinRAR test from 2013 is updated to the latest version of WinRAR at the start of 2014. We compress a set of 2867 files across 320 folders totaling 1.52 GB in size – 95% of these files are small typical website files, and the rest (90% of the size) are small 30 second 720p videos.
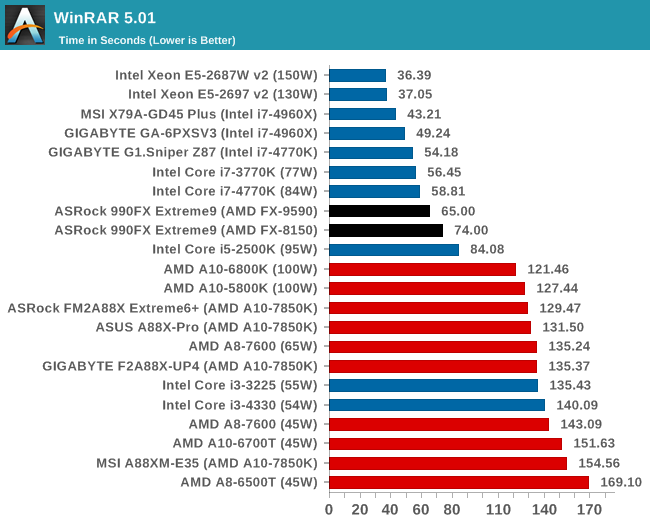
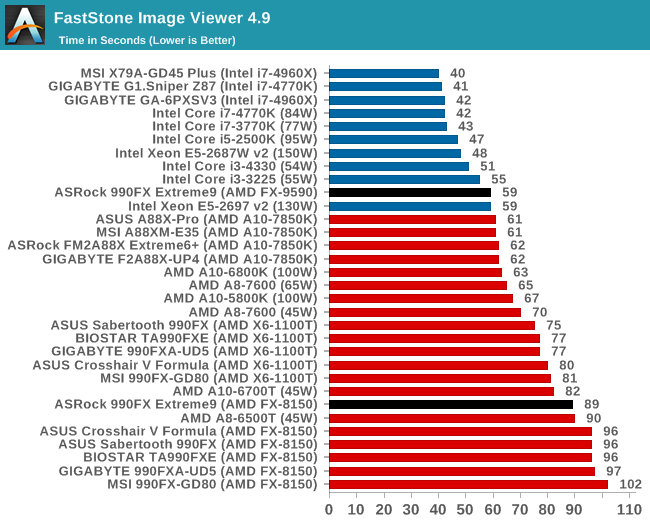
Image Manipulation – FastStone Image Viewer 4.9: link
FastStone is the program I use to perform quick or bulk actions on images, such as resizing, adjusting for color and cropping. In our test we take a series of 170 images in various sizes and formats and convert them all into 640x480 .gif files, maintaining the aspect ratio. FastStone does not use multithreading for this test, and results are given in seconds.
The FX-8150 result for the Extreme9 compared to other motherboards shows one of two things - the latest Windows SP1 with core parking updates has an effect, or the BIOS is more efficient at handling turbo modes than our older reviews.
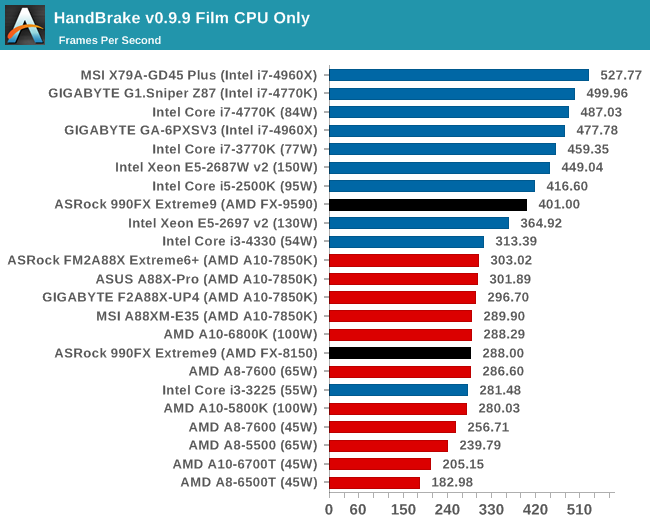
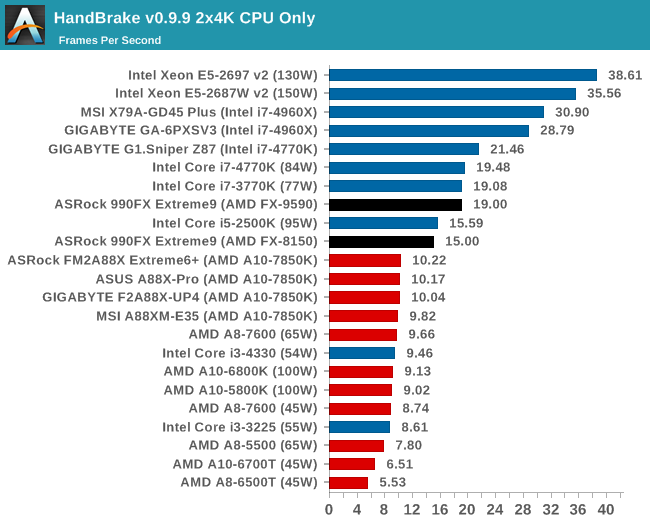
Video Conversion – Handbrake v0.9.9: link
For HandBrake, we take two videos (a 2h20 640x266 DVD rip and a 10min double UHD 3840x4320 animation short) and convert them to x264 format in an MP4 container. Results are given in terms of the frames per second processed, and HandBrake uses as many threads as possible.
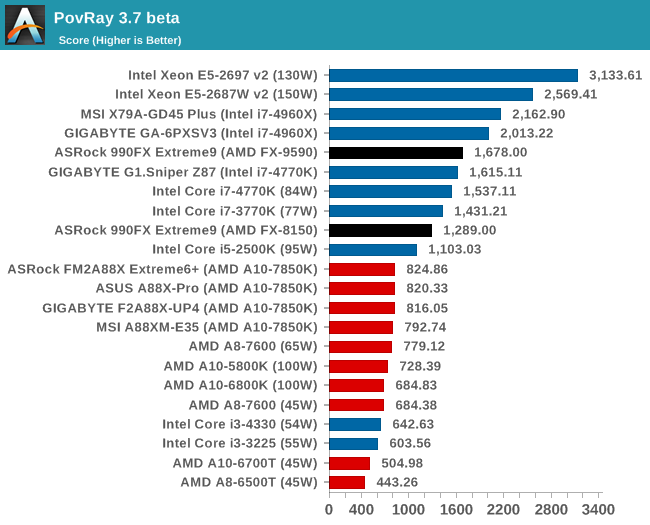
Rendering – PovRay 3.7: link
The Persistence of Vision RayTracer, or PovRay, is a freeware package for as the name suggests, ray tracing. It is a pure renderer, rather than modeling software, but the latest beta version contains a handy benchmark for stressing all processing threads on a platform. We have been using this test in motherboard reviews to test memory stability at various CPU speeds to good effect – if it passes the test, the IMC in the CPU is stable for a given CPU speed. As a CPU test, it runs for approximately 2-3 minutes on high end platforms.
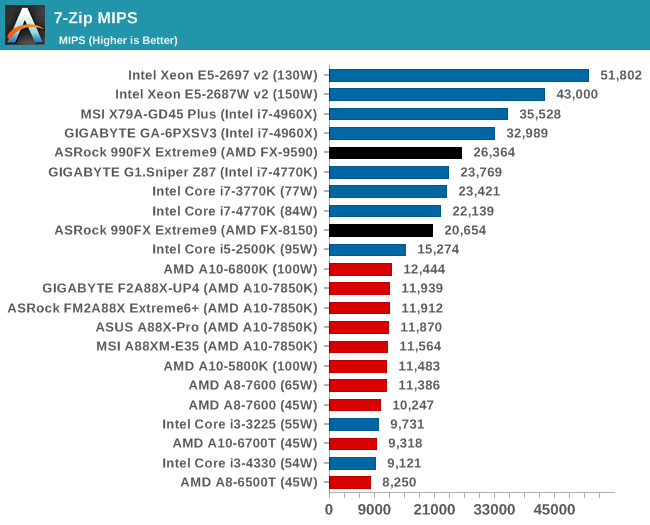
Synthetic – 7-Zip 9.2: link
As an open source compression tool, 7-Zip is a popular tool for making sets of files easier to handle and transfer. The software offers up its own benchmark, to which we report the result.


146 Comments
View All Comments
dave1231 - Saturday, August 9, 2014 - link
Running this chip at load 24/7 at 18p per kWh for a year would cost about £525 although you might be able to turn your heating down a bit. Should be consigned to history.tech6 - Saturday, August 9, 2014 - link
+1: Such abysmal efficiency makes no sense at all. If this is supposed to be a 2014 product then I fear for the future of AMD.shabby - Saturday, August 9, 2014 - link
Efficiency goes out the door once you start overclocking.Flunk - Saturday, August 9, 2014 - link
That's not true at all, a lot of Intel CPUs will take a supstantial overclock with no or very slight voltage adjustments and then not exceed TDP by more than 25%. Overclocking THIS processor throws efficiency out the door but there are gains to be made at reasonable costs with Intel's Core processors.shabby - Saturday, August 9, 2014 - link
An extra 1ghz on an i7-4770k increases wattage by 60%http://www.pcper.com/files/imagecache/article_max_...
Which article is showing a 25% increase?
SmokingCrop - Saturday, August 9, 2014 - link
This one does: http://www.bit-tech.net/hardware/2013/06/01/intel-...Intel Core i7-4770K
3.5GHz -> 137 Watt
4.7GHz -> 171 Watt
shabby - Saturday, August 9, 2014 - link
One article shows a 25% increase with a 1.2ghz oc while another shows 60% increase with a 1ghz oc ... so which ones right?tuxRoller - Sunday, August 10, 2014 - link
Possibly both. Depends on where these tests are done (the line voltage), components used, and, most importantly, the binning.basroil - Sunday, August 10, 2014 - link
Both can be correct, depends on the test. Chips aren't as easy as pipeline clock increases, memory limited applications are still fairly common, as are cache limited ones (L1 cache should increase in speed but L2 and L3 won't in most cases), and there are still others that are unstable and can see huge jumps depending on how in sync components are.That said, seeing a performance increase larger than the clock increase (all in %) is rare at best, downright lying in most cases though. Usually a 50% increase will give you a 25-50% increase in non-memory limited applications.
basroil - Sunday, August 10, 2014 - link
Strike the above, misread the comment!But actually very close, just replace everything with mobo, cooling, and lot. Some chips overclock better than others, and some motherboards and cooling help achieve that at lower voltages (and therefore power) than others. Your CPU might need 1.2V to hit 4.5gh while another needs 1.25V just to hit 4, it's just the luck of the draw.