AMD’s 5 GHz Turbo CPU in Retail: The FX-9590 and ASRock 990FX Extreme9 Review
by Ian Cutress on August 9, 2014 8:00 AM ESTCPU Benchmarks: Comparing the AMD FX-9590
The dynamics of CPU Turbo modes, both Intel and AMD, can cause concern during environments with a variable threaded workload. There is also an added issue of the motherboard remaining consistent, depending on how the motherboard manufacturer wants to add in their own boosting technologies over the ones that Intel would prefer they used. In order to remain consistent, we implement an OS-level unique high performance mode on all the CPUs we test which should override any motherboard manufacturer performance mode.
It is worth noting that the FX-9590, against the A10-7850K for example, has double the threads and +1 GHz of core speed, despite the generational gap. Considering only these factors, the FX-9590 is most likely similar if not better at single threaded performance, but also 2x for multithreaded results.
HandBrake v0.9.9: link
For HandBrake, we take two videos (a 2h20 640x266 DVD rip and a 10min double UHD 3840x4320 animation short) and convert them to x264 format in an MP4 container. Results are given in terms of the frames per second processed, and HandBrake uses as many threads as possible.
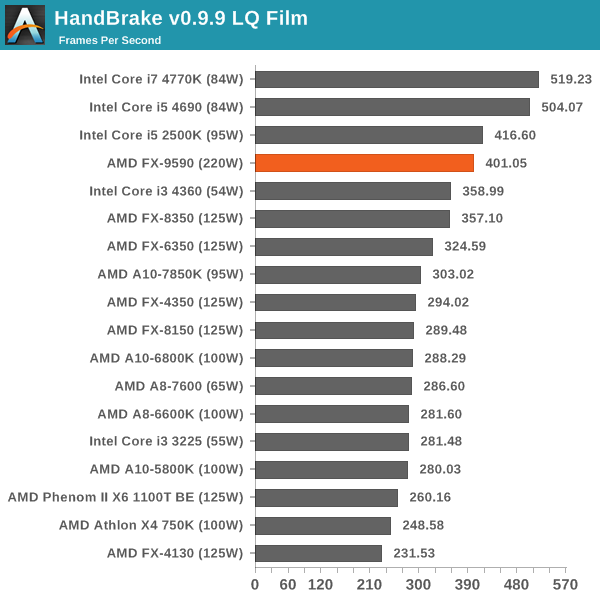
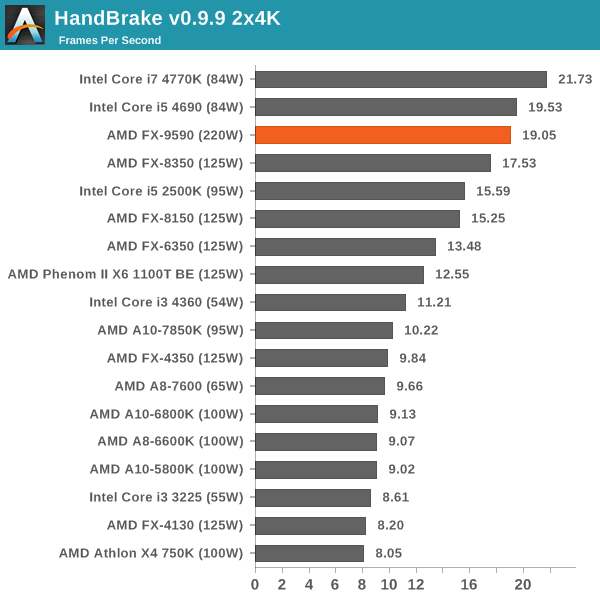
The eight threads of the FX-9590 give it almost another third of performance over the A10-7850K for small frame videos and nearly 2x for the larger frame conversion.
Agisoft Photoscan – 2D to 3D Image Manipulation: link
Agisoft Photoscan creates 3D models from 2D images, a process which is very computationally expensive. The algorithm is split into four distinct phases, and different phases of the model reconstruction require either fast memory, fast IPC, more cores, or even OpenCL compute devices to hand. Agisoft supplied us with a special version of the software to script the process, where we take 50 images of a stately home and convert it into a medium quality model. This benchmark typically takes around 15-20 minutes on a high end PC on the CPU alone, with GPUs reducing the time.
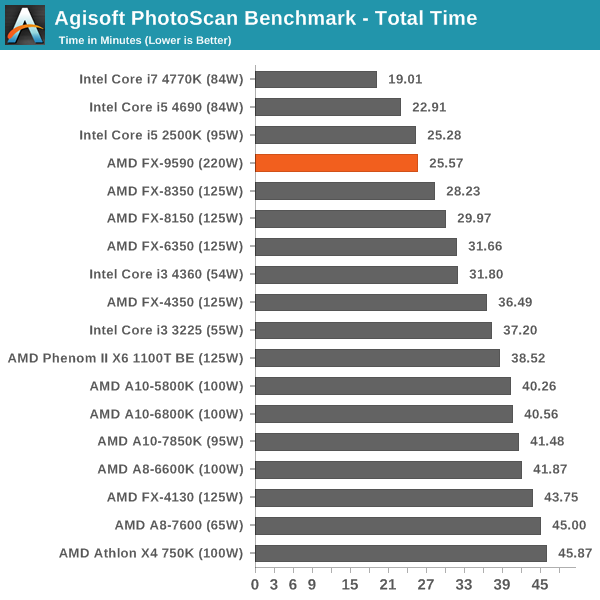
The FX-9590 puts in the best AMD CPU performance, similar to that of the i5-2500K.
Dolphin Benchmark: link
Many emulators are often bound by single thread CPU performance, and general reports tended to suggest that Haswell provided a significant boost to emulator performance. This benchmark runs a Wii program that raytraces a complex 3D scene inside the Dolphin Wii emulator. Performance on this benchmark is a good proxy of the speed of Dolphin CPU emulation, which is an intensive single core task using most aspects of a CPU. Results are given in minutes, where the Wii itself scores 17.53 minutes.
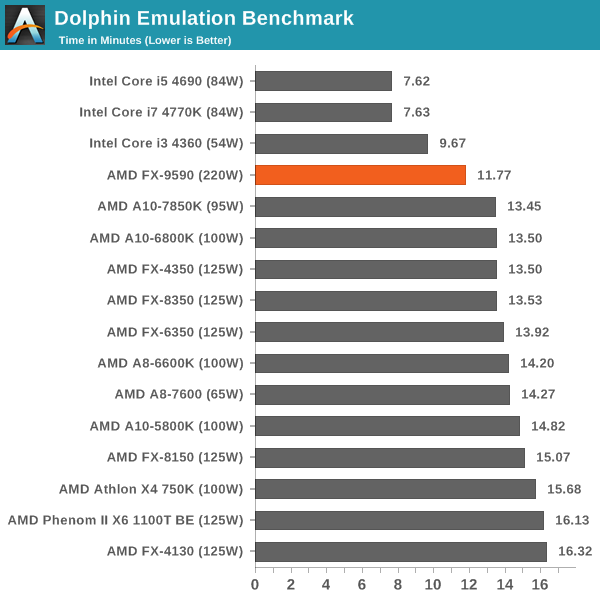
The FX-9590 beats almost everything pre-Haswell, showing the strength of a 5.0 GHz turbo mode. Note that it compares to the 3.5 GHz, 4MB L3 cache Haswell, which is 1.5 GHz slower and has half the L3.
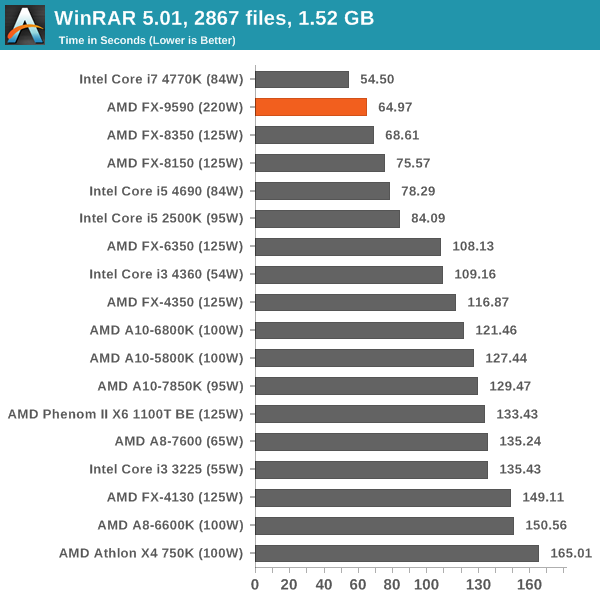
WinRAR 5.0.1: link
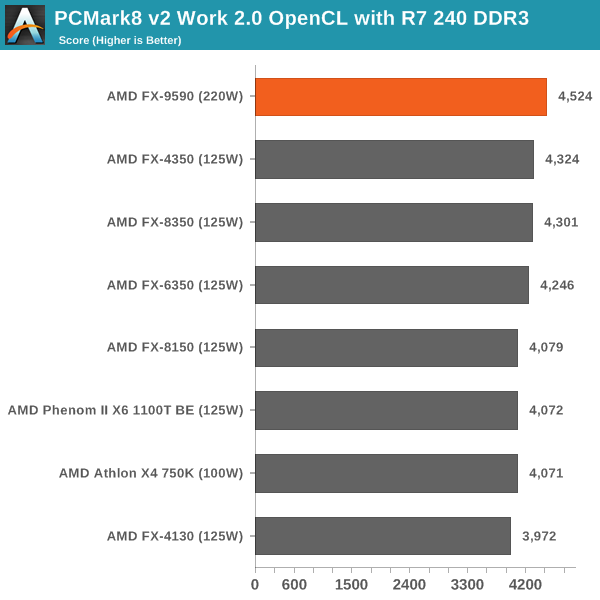
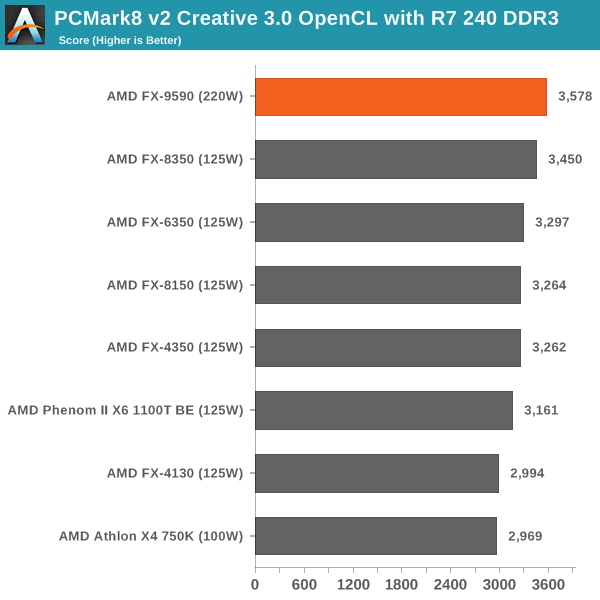
PCMark8 v2 OpenCL on R7 240
A new addition to our CPU testing suite is PCMark8 v2, where we test the Work 2.0 and Creative 3.0 suites in OpenCL mode.
Hybrid x265
Hybrid is a new benchmark, where we take a 4K 1500 frame video and convert it into an x265 format without audio. Results are given in frames per second.
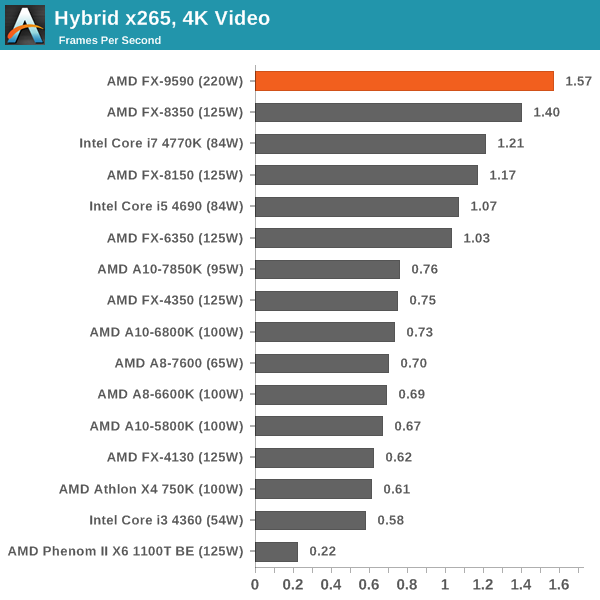
The FX-9590 holds up very well in the Hybrid x265 conversion, which makes me wonder how well an 8-thread Kaveri CPU would perform.
Cinebench R15
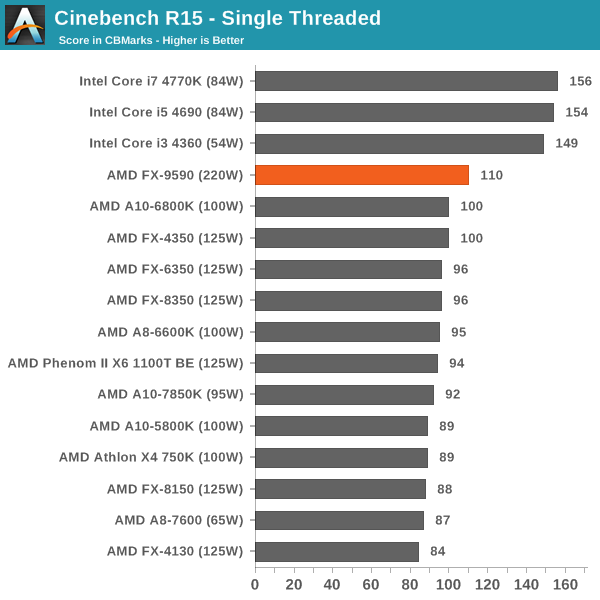
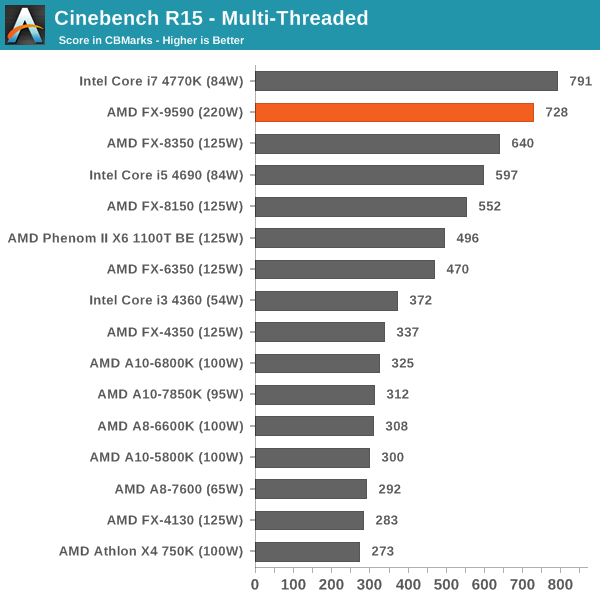
The FX-9590 still has the single thread edge over the newer AMD CPUs due to the high frequency, but is easily overtaken by the modern cheap Intel CPUs. For multithreaded competition, the 8 threads needs an 8 threaded Intel CPU to compete.
3D Particle Movement
3DPM is a self-penned benchmark, taking basic 3D movement algorithms used in Brownian Motion simulations and testing them for speed. High floating point performance, MHz and IPC wins in the single thread version, whereas the multithread version has to handle the threads and loves more cores.
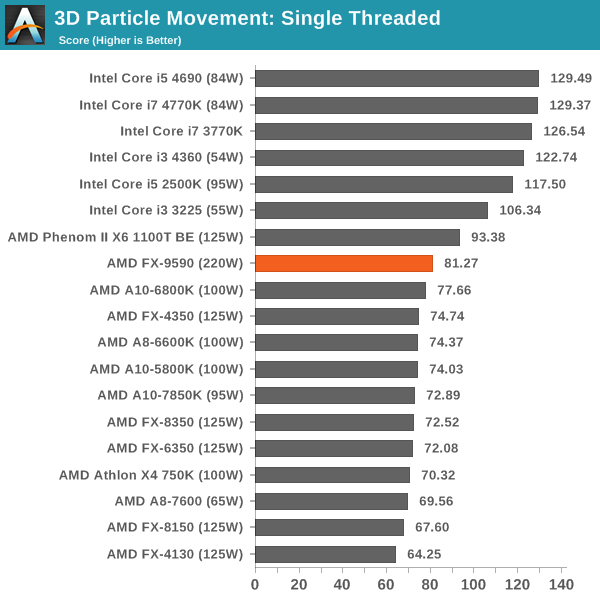
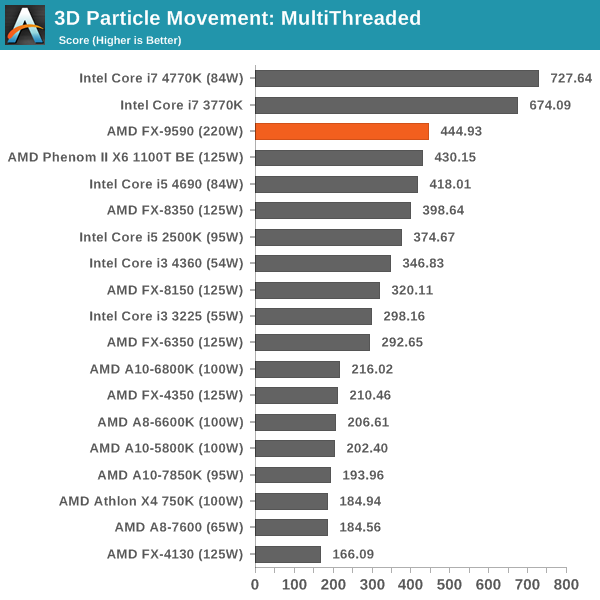
Although the FX-9590 again performs as the best AMD CPU, the floating point nature of the calculations in this test seems not to be favored by this architecture.
FastStone Image Viewer 4.9
FastStone is the program I use to perform quick or bulk actions on images, such as resizing, adjusting for color and cropping. In our test we take a series of 170 images in various sizes and formats and convert them all into 640x480 .gif files, maintaining the aspect ratio. FastStone does not use multithreading for this test, and results are given in seconds.
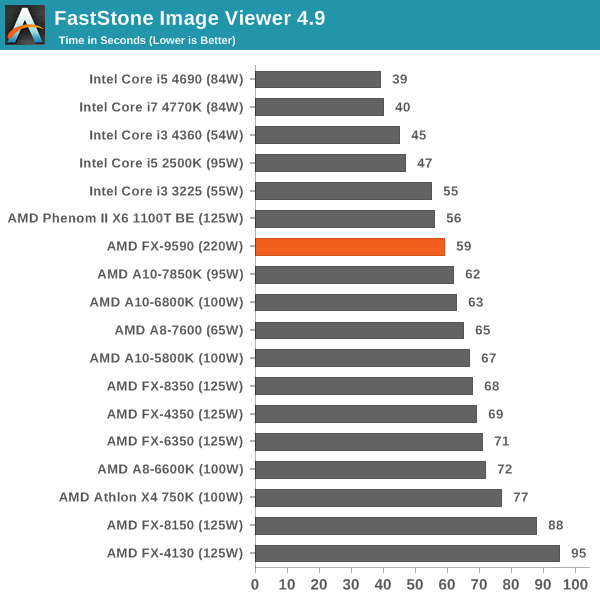
Similarly to 3DPM, for basic photo conversion any base 3.2 GHz Haswell CPU can outperform a 5.0 GHz AMD.


146 Comments
View All Comments
dave1231 - Saturday, August 9, 2014 - link
Running this chip at load 24/7 at 18p per kWh for a year would cost about £525 although you might be able to turn your heating down a bit. Should be consigned to history.tech6 - Saturday, August 9, 2014 - link
+1: Such abysmal efficiency makes no sense at all. If this is supposed to be a 2014 product then I fear for the future of AMD.shabby - Saturday, August 9, 2014 - link
Efficiency goes out the door once you start overclocking.Flunk - Saturday, August 9, 2014 - link
That's not true at all, a lot of Intel CPUs will take a supstantial overclock with no or very slight voltage adjustments and then not exceed TDP by more than 25%. Overclocking THIS processor throws efficiency out the door but there are gains to be made at reasonable costs with Intel's Core processors.shabby - Saturday, August 9, 2014 - link
An extra 1ghz on an i7-4770k increases wattage by 60%http://www.pcper.com/files/imagecache/article_max_...
Which article is showing a 25% increase?
SmokingCrop - Saturday, August 9, 2014 - link
This one does: http://www.bit-tech.net/hardware/2013/06/01/intel-...Intel Core i7-4770K
3.5GHz -> 137 Watt
4.7GHz -> 171 Watt
shabby - Saturday, August 9, 2014 - link
One article shows a 25% increase with a 1.2ghz oc while another shows 60% increase with a 1ghz oc ... so which ones right?tuxRoller - Sunday, August 10, 2014 - link
Possibly both. Depends on where these tests are done (the line voltage), components used, and, most importantly, the binning.basroil - Sunday, August 10, 2014 - link
Both can be correct, depends on the test. Chips aren't as easy as pipeline clock increases, memory limited applications are still fairly common, as are cache limited ones (L1 cache should increase in speed but L2 and L3 won't in most cases), and there are still others that are unstable and can see huge jumps depending on how in sync components are.That said, seeing a performance increase larger than the clock increase (all in %) is rare at best, downright lying in most cases though. Usually a 50% increase will give you a 25-50% increase in non-memory limited applications.
basroil - Sunday, August 10, 2014 - link
Strike the above, misread the comment!But actually very close, just replace everything with mobo, cooling, and lot. Some chips overclock better than others, and some motherboards and cooling help achieve that at lower voltages (and therefore power) than others. Your CPU might need 1.2V to hit 4.5gh while another needs 1.25V just to hit 4, it's just the luck of the draw.