ADATA Premier SP610 SSD (256GB & 512GB) Review: Say Hello to an SMI Controller
by Kristian Vättö on June 27, 2014 2:00 PM EST- Posted in
- Storage
- SSDs
- ADATA
- SP610
- Silicon Motion
AnandTech Storage Bench 2013
Our Storage Bench 2013 focuses on worst-case multitasking and IO consistency. Similar to our earlier Storage Benches, the test is still application trace based - we record all IO requests made to a test system and play them back on the drive we are testing and run statistical analysis on the drive's responses. There are 49.8 million IO operations in total with 1583.0GB of reads and 875.6GB of writes. I'm not including the full description of the test for better readability, so make sure to read our Storage Bench 2013 introduction for the full details.
| AnandTech Storage Bench 2013 - The Destroyer | ||
| Workload | Description | Applications Used |
| Photo Sync/Editing | Import images, edit, export | Adobe Photoshop CS6, Adobe Lightroom 4, Dropbox |
| Gaming | Download/install games, play games | Steam, Deus Ex, Skyrim, Starcraft 2, BioShock Infinite |
| Virtualization | Run/manage VM, use general apps inside VM | VirtualBox |
| General Productivity | Browse the web, manage local email, copy files, encrypt/decrypt files, backup system, download content, virus/malware scan | Chrome, IE10, Outlook, Windows 8, AxCrypt, uTorrent, AdAware |
| Video Playback | Copy and watch movies | Windows 8 |
| Application Development | Compile projects, check out code, download code samples | Visual Studio 2012 |
We are reporting two primary metrics with the Destroyer: average data rate in MB/s and average service time in microseconds. The former gives you an idea of the throughput of the drive during the time that it was running the test workload. This can be a very good indication of overall performance. What average data rate doesn't do a good job of is taking into account response time of very bursty (read: high queue depth) IO. By reporting average service time we heavily weigh latency for queued IOs. You'll note that this is a metric we have been reporting in our enterprise benchmarks for a while now. With the client tests maturing, the time was right for a little convergence.
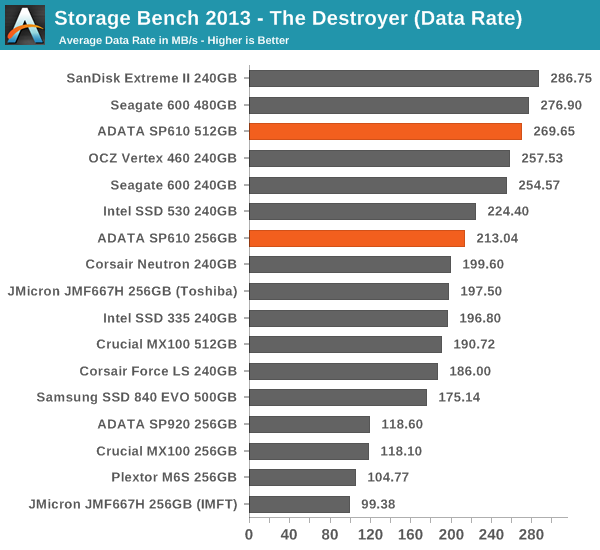
Well, this doesn't make much sense. The service times aren't anything special, yet the average data rate is surprisingly high. For instance the 256GB JMF667H drive has lower service time but the average data rate is lower.
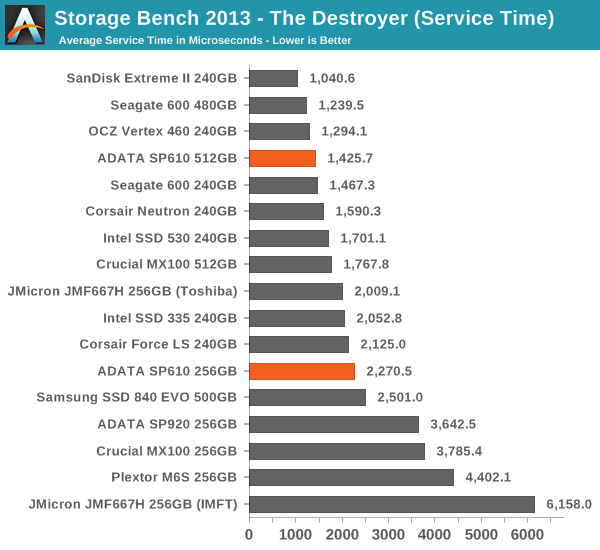
For this to make some sense, let's look at the service times for reads and writes separately.
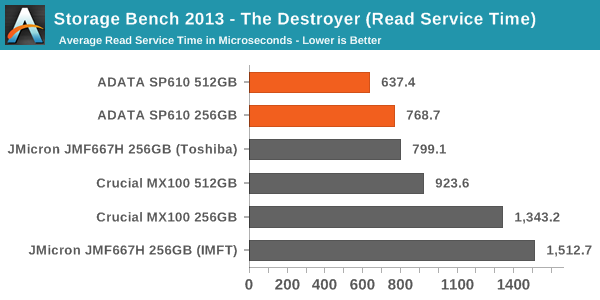
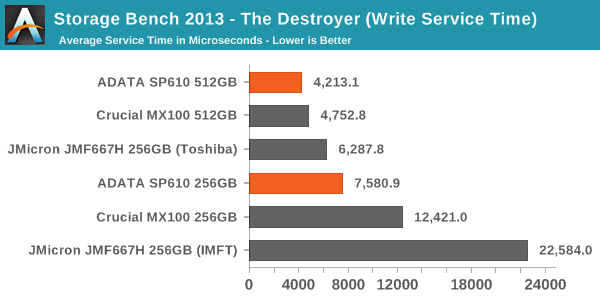
Now this makes more sense. Due to the relatively poor IO consistency of the SP610, the write service times are quite high. That increases the average service time substantially but the impact on average data rate is smaller, and the reason for that is quite simple.
To keep thing simple, imagine that it takes five seconds to write 128KB of sequential data and one second to write 4KB of random data. In other words, it takes six seconds to write 132KB of data, which works out to be 22KB/s. However, the 128KB write operation completed at 25.6KB/s, whereas the throughput of the 4KB write operation was only 4KB/s. 22KB/s is certainly much closer to 25.6KB/s than 4KB/s, meaning that the average data rate gives more emphasis to the large transfer because frankly it counts more when looking at amount of data that was transferred.
But now add in the service time. It took a total of six seconds to complete two IOs, which means that the average service time is three seconds. It doesn't matter that the other IO is much larger because service time only looks at the completion time of an IO, regardless of its size. Because of that, the service times give more information about small IO performance than the average data rate where the small IOs are buried under the larger transfers.
In the context of the SP610, this means that it performs well with large IOs as the data rate is high. Only about 30% of the IOs in the trace are 4KB, whereas 40% are 64KB and 20% are 128KB. With small IOs the performance is not bad but for instance the JMF667H does slightly better, resulting in lower service times. Despite the mediocre performance consistency on the previous page, overall the SP610 does very well in the 2013 Storage Bench and potentially offers users better performance than the MX100, 840 EVO and JMF667H.


24 Comments
View All Comments
nicolapeluchetti - Friday, June 27, 2014 - link
Has anyone any idea on why the Samsung SSD 840 Pro is so bad in Anandtech Bench 2013 and so good in 2011? Here is the link it did 142 in 2013 http://www.anandtech.com/show/8170/sandisk-extreme... Nut in 2011 it's number 1 http://www.anandtech.com/show/8170/sandisk-extreme...How is this possible?I mean are the workloads so different?Did Samsung optimize the controller for the test?
WithoutWeakness - Friday, June 27, 2014 - link
The 2013 Bench is definitely different enough to have different results for a given drive. More detailed info on the differences between the 2011 and 2013 benches can be found here: http://www.anandtech.com/show/6884/crucial-micron-...Muyoso - Friday, June 27, 2014 - link
Yea, I bought the 840 Pro on the basis of that 2011 test bench, and now everytime I see an SSD review I am sad to see how ravaged it gets vs the competition.CrystalBay - Friday, June 27, 2014 - link
I wouldn't worry about the 840P it still a top drive with excellent support . Come this September Samsung is going bring out some new drives. I'm very curious about what's next from them.Kristian Vättö - Friday, June 27, 2014 - link
Maybe September is coming sooner than you think ;-)CrystalBay - Friday, June 27, 2014 - link
Oh what a nice surprise ! can't wait....Galatian - Saturday, June 28, 2014 - link
Which answers my question wether I should get the XP941 now for my ASRock Extreme9 or wait ;-)Khenglish - Friday, June 27, 2014 - link
It has to do with how the 840Pro handles garbage collection. Basically the way the 2013 test is structured the 840Pro delays far longer than it should before reorganizing itself, but the 2011 test is less stressful in this regard. This means that the 840Pro is a very fast drive if you don't have it running at 100% at all times, but if you are then other drives are likely preferable.althaz - Sunday, June 29, 2014 - link
The 2013 test is more enterprisey. The 2011 test is a better indicator of performance if you half-fill your SSD and use it for your OS plus a few core apps. If you fill it up and use it for everything, the 2013 test is more useful.nitro912gr - Friday, June 27, 2014 - link
I can find the evo 840 250GB at the same price with that adata sp610, should I go with the later since it is bundled with the 3.5" case?I can't see much more difference aside that.