Samsung Galaxy Tab Pro 8.4 and 10.1 Review
by Jarred Walton on March 22, 2014 9:30 PM ESTLCD Testing: A Feast for Your Eyes
Let’s start out the testing by going straight to the biggest draw with the Galaxy Pro tablets: the WQXGA displays. Even without testing, I could see by looking that the colors on the Pro 10.1 looked a bit better/more natural than on the Pro 8.4, but I was curious to see if the colors were truly accurate or merely not as oversaturated. Depending on your display setting, it’s a little of both.
I tested the Pro 10.1 in four modes (“Auto”, Dynamic, Standard, and Movie), and contrary to what I’ve seen reported elsewhere, the Movie mode resulted in the most accurate colors. Most tablets and laptops often use white points that are far too hot (blue), and that applies to the 10.1 on the Dynamic and Standard modes, though Standard is a bit better perhaps; it also applies to the Pro 8.4 display. The Movie mode on the other hand clearly reduces the saturation levels and ends up being very good overall. Here are five sets of galleries showing the testing results for the various display modes on the 10.1 as well as the sole mode on the 8.4.


As for brightness, contrast, and DeltaE results, both models do reasonably well, again with the color accuracy advantage going to the 10.1. Keep in mind that the only other tablets in these charts just happen to be some of the best displays on the market, with the iPad Air being factory calibrated and the Nexus 7 being one of the best non-Apple devices in terms of color accuracy.
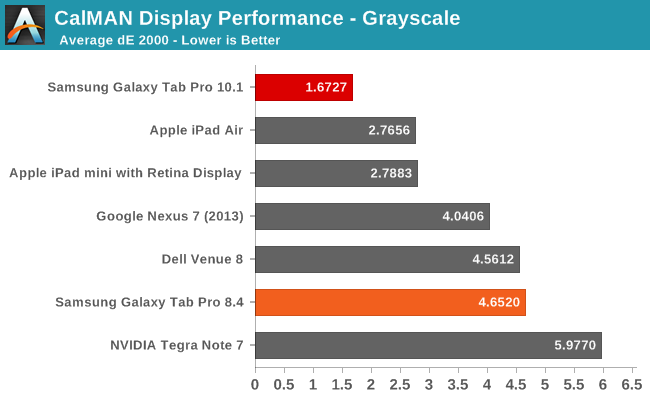
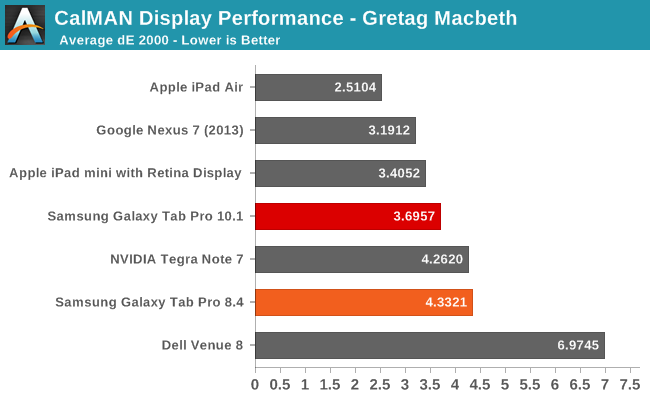
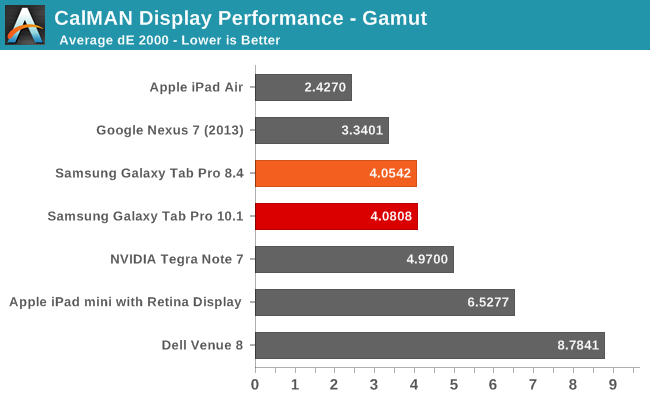
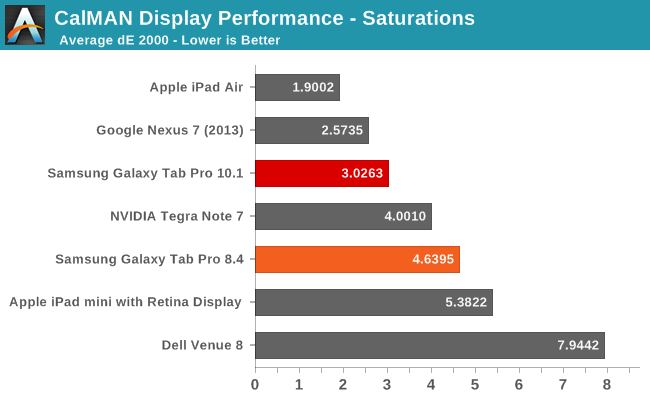
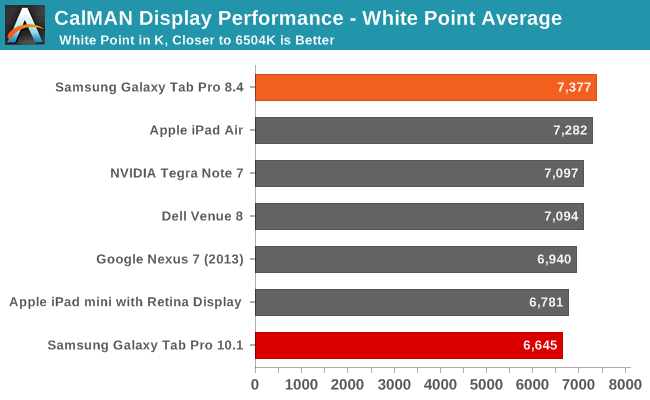
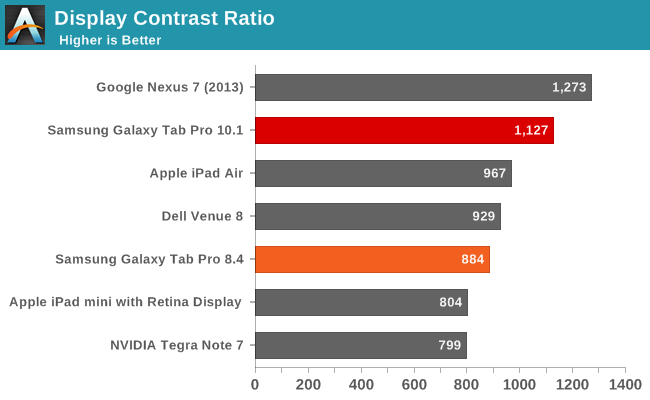

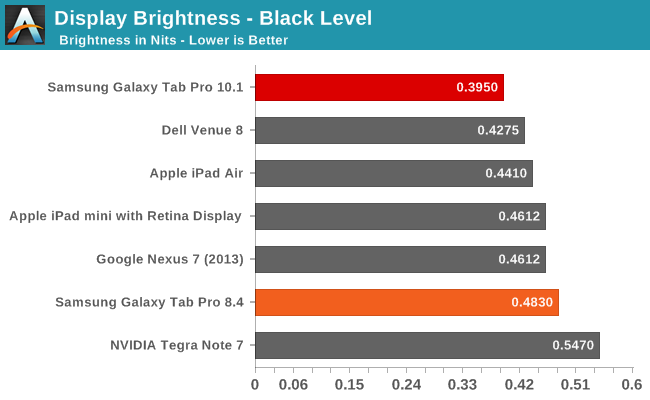
While none of the results are necessarily standouts (other than the grayscale dE 2000 on the Pro 10.1), we again have to keep in mind the fact that these are 2560x1600 panels in 10.1 and 8.4 inch devices. Factory calibration would push them over the top, but even without that they’re going to provide a wow factor to anyone used to lower resolution, lower quality displays.


125 Comments
View All Comments
SilthDraeth - Saturday, March 22, 2014 - link
On my note phone if I want to take a screenshot, I hold the power button and the Samsung Home button. Give that a try. Or, on my wife's note 10.1 first edition, it has a dedicated screenshot softkey that appears where your normal android home keys, etc appear.FwFred - Sunday, March 23, 2014 - link
LOL... 'Pro'. Surface Pro 2 just fell off the chair laughing.garret_merrill - Friday, October 3, 2014 - link
Really good tablets, although I would seriously consider the Note Pro series too (highly ranked by a number of sources, see http://www.consumertop.com/best-tablets/). But either way, the Samsung tables deliver fantastic quality.Brian Z - Saturday, March 22, 2014 - link
Antutu? Really... Maybe somebody kidnapped Anand and Brian. Frigging Antutugrahaman27 - Saturday, March 22, 2014 - link
Better than just posting the browser speed tests for CPU, and draw final thoughts from that, which they have gotten in a habit of doing.JarredWalton - Sunday, March 23, 2014 - link
What's wrong with running one more benchmark and listing results for it? Sheesh... most of the time people complain about not having enough data, and now someone is upset for me running AnTuTu. Yes, I know companies have "cheated" on it in the past, but the latest revision seems about as valid in its reported scores as any of the other benchmarks. Now if it wouldn't crash half the time, that would be great. :-\Egg - Sunday, March 23, 2014 - link
You do realize that Brian has, for all intents and purposes, publicly cursed AnTuTu and mocked the journalists who used it?JarredWalton - Sunday, March 23, 2014 - link
The big problem is people that *only* (or primarily) use AnTuTu and rely on it as a major source of performance data. I'm not comparing AnTuTu scores with tons of devices; what I've done is provide Samsung Galaxy Tab Pro 8.4 vs. 10.1 scores, mostly to show what happens when the CPU in the 10.1 hits 1.8-1.9 GHz. It's not "cheating" to do that either -- it's just that the JavaScript tests mostly don't go above 1.2-1.3GHz for whatever reason. Octane and many other benchmarks hit higher clocks, but Sunspider and Kraken specifically do not. It's probably an architectural+governor thing, where the active threads bounce around the cores of the Exynos enough that they don't trigger higher clocks.Don't worry -- we're not suddenly changing stances on Geekbench, AnTuTu, etc. but given the odd clocks I was seeing with the 10.1 I wanted to check a few more data points. Hopefully that clarifies things? It was Brian after all that used AnTuTu to test for cheating (among other things).
Wilco1 - Sunday, March 23, 2014 - link
The reason for the CPU clock staying low is because the subtests in Sunspider and AnTuTu only take a few milliseconds (Anand showed this in graphs a while back). That means there is not enough time to boost the frequency to the maximum (this takes some time). Longer running benchmarks like Geekbench are fine. I wouldn't be surprised if the governor will soon start to recognize these microbenchmarks by their repeated bursty behaviour rather than by their name...Of course the AnTuTu and Javascript benchmarks suffer from many other issues, such as not using geomean to calculate the average (making it easy to cheat by speeding up just one subtest) and using tiny unrepresentative micro benchmarks far simpler than even Dhrystone.
Also it would be nice to see a bit more detail about the first fully working big/little octa core with GTS enabled. Previously AnandTech has been quite negative about the power consumption of Cortex-A15, and now it looks the 5420 beats Krait on power efficiency while having identical performance...
virtual void - Monday, March 24, 2014 - link
You cannot disregard the result produced by something just because the load generated by the benchmark comes in very short burst, that is the _typical_ workload faced by these kind of devices.The result in Geekbench give you some hint how the device would handle HPC-workloads, it give you very limited information about how well it handles mobile apps. Another problem with Geekbench is that it runs almost entirely out of L1$. 97% of the memory accesses where reported as L1-hits on a Sandy Bridge CPU (32kB L1D$). Not even mobile apps has such a small working set.
big.LITTLE is always at a disadvantage vs one single core in bursty workloads as the frequency transition latency is relatively high when switching CPU-cores. Low P-state switching time probably explains why BayTrail "feels" a lot faster than what the benchmarks like Geekbench suggest. BayTrail has a P-state latency of 10µs while ARM SoCs (without big.LITTLE) seem to lie between 0.1ms - 1ms (according to the Linux device-tree information).