Samsung SSD 840 EVO Review: 120GB, 250GB, 500GB, 750GB & 1TB Models Tested
by Anand Lal Shimpi on July 25, 2013 1:53 PM EST- Posted in
- Storage
- SSDs
- Samsung
- TLC
- Samsung SSD 840
AnandTech Storage Bench 2013
When I built the AnandTech Heavy and Light Storage Bench suites in 2011 I did so because we didn't have any good tools at the time that would begin to stress a drive's garbage collection routines. Once all blocks have a sufficient number of used pages, all further writes will inevitably trigger some sort of garbage collection/block recycling algorithm. Our Heavy 2011 test in particular was designed to do just this. By hitting the test SSD with a large enough and write intensive enough workload, we could ensure that some amount of GC would happen.
There were a couple of issues with our 2011 tests that I've been wanting to rectify however. First off, all of our 2011 tests were built using Windows 7 x64 pre-SP1, which meant there were potentially some 4K alignment issues that wouldn't exist had we built the trace on a system with SP1. This didn't really impact most SSDs but it proved to be a problem with some hard drives. Secondly, and more recently, I've shifted focus from simply triggering GC routines to really looking at worst case scenario performance after prolonged random IO. For years I'd felt the negative impacts of inconsistent IO performance with all SSDs, but until the S3700 showed up I didn't think to actually measure and visualize IO consistency. The problem with our IO consistency tests are they are very focused on 4KB random writes at high queue depths and full LBA spans, not exactly a real world client usage model. The aspects of SSD architecture that those tests stress however are very important, and none of our existing tests were doing a good job of quantifying that.
I needed an updated heavy test, one that dealt with an even larger set of data and one that somehow incorporated IO consistency into its metrics. I think I have that test. I've just been calling it The Destroyer (although AnandTech Storage Bench 2013 is likely a better fit for PR reasons).
Everything about this new test is bigger and better. The test platform moves to Windows 8 Pro x64. The workload is far more realistic. Just as before, this is an application trace based test - I record all IO requests made to a test system, then play them back on the drive I'm measuring and run statistical analysis on the drive's responses.
Imitating most modern benchmarks I crafted the Destroyer out of a series of scenarios. For this benchmark I focused heavily on Photo editing, Gaming, Virtualization, General Productivity, Video Playback and Application Development. Rough descriptions of the various scenarios are in the table below:
| AnandTech Storage Bench 2013 Preview - The Destroyer | ||||||||||||
| Workload | Description | Applications Used | ||||||||||
| Photo Sync/Editing | Import images, edit, export | Adobe Photoshop CS6, Adobe Lightroom 4, Dropbox | ||||||||||
| Gaming | Download/install games, play games | Steam, Deus Ex, Skyrim, Starcraft 2, BioShock Infinite | ||||||||||
| Virtualization | Run/manage VM, use general apps inside VM | VirtualBox | ||||||||||
| General Productivity | Browse the web, manage local email, copy files, encrypt/decrypt files, backup system, download content, virus/malware scan | Chrome, IE10, Outlook, Windows 8, AxCrypt, uTorrent, AdAware | ||||||||||
| Video Playback | Copy and watch movies | Windows 8 | ||||||||||
| Application Development | Compile projects, check out code, download code samples | Visual Studio 2012 | ||||||||||
While some tasks remained independent, many were stitched together (e.g. system backups would take place while other scenarios were taking place). The overall stats give some justification to what I've been calling this test internally:
| AnandTech Storage Bench 2013 Preview - The Destroyer, Specs | |||||||||||||
| The Destroyer (2013) | Heavy 2011 | ||||||||||||
| Reads | 38.83 million | 2.17 million | |||||||||||
| Writes | 10.98 million | 1.78 million | |||||||||||
| Total IO Operations | 49.8 million | 3.99 million | |||||||||||
| Total GB Read | 1583.02 GB | 48.63 GB | |||||||||||
| Total GB Written | 875.62 GB | 106.32 GB | |||||||||||
| Average Queue Depth | ~5.5 | ~4.6 | |||||||||||
| Focus | Worst case multitasking, IO consistency | Peak IO, basic GC routines | |||||||||||
SSDs have grown in their performance abilities over the years, so I wanted a new test that could really push high queue depths at times. The average queue depth is still realistic for a client workload, but the Destroyer has some very demanding peaks. When I first introduced the Heavy 2011 test, some drives would take multiple hours to complete it - today most high performance SSDs can finish the test in under 90 minutes. The Destroyer? So far the fastest I've seen it go is 10 hours. Most high performance I've tested seem to need around 12 - 13 hours per run, with mainstream drives taking closer to 24 hours. The read/write balance is also a lot more realistic than in the Heavy 2011 test. Back in 2011 I just needed something that had a ton of writes so I could start separating the good from the bad. Now that the drives have matured, I felt a test that was a bit more balanced would be a better idea.
Despite the balance recalibration, there's just a ton of data moving around in this test. Ultimately the sheer volume of data here and the fact that there's a good amount of random IO courtesy of all of the multitasking (e.g. background VM work, background photo exports/syncs, etc...) makes the Destroyer do a far better job of giving credit for performance consistency than the old Heavy 2011 test. Both tests are valid, they just stress/showcase different things. As the days of begging for better random IO performance and basic GC intelligence are over, I wanted a test that would give me a bit more of what I'm interested in these days. As I mentioned in the S3700 review - having good worst case IO performance and consistency matters just as much to client users as it does to enterprise users.
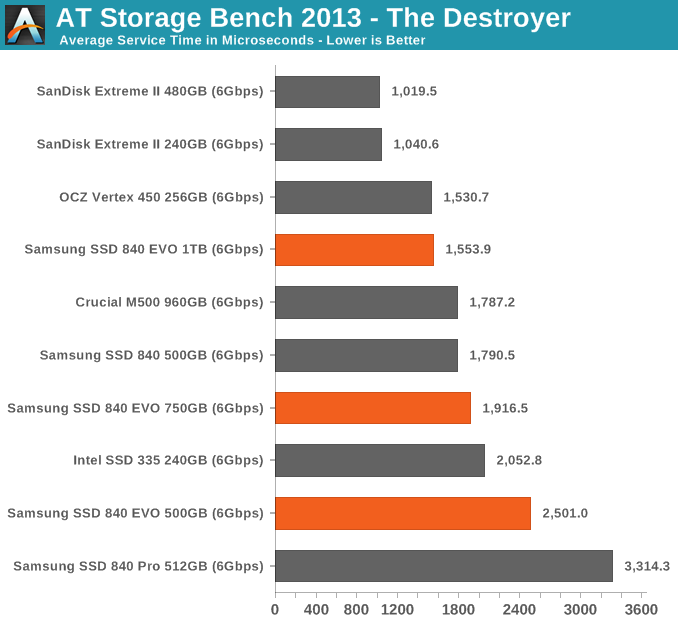
I'm reporting two primary metrics with the Destroyer: average data rate in MB/s and average service time in microseconds. The former gives you an idea of the throughput of the drive during the time that it was running the Destroyer workload. This can be a very good indication of overall performance. What average data rate doesn't do a good job of is taking into account response time of very bursty (read: high queue depth) IO. By reporting average service time we heavily weigh latency for queued IOs. You'll note that this is a metric I've been reporting in our enterprise benchmarks for a while now. With the client tests maturing, the time was right for a little convergence.
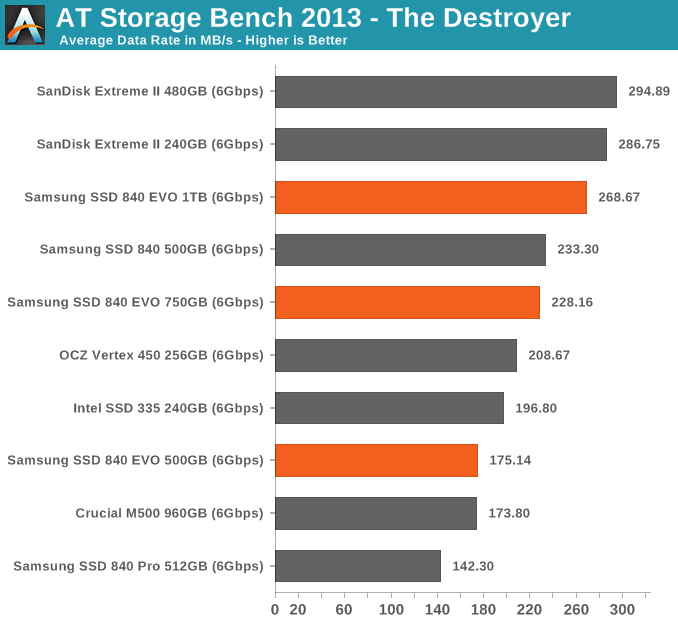
There's simply no comparison between the EVO and Crucial's M500. Even at half the capacity, the EVO does a better job in our consistency test. SanDisk's Extreme II remains the king here but that's more of a performance tuned part vs. something that offers better cost per GB. Note just how impactful the added spare is on giving the EVO an advantage over even the 840 Pro. It's so very important that 840 Pro owners keep as much free space on the drive as possible to keep performance high and consistent.


137 Comments
View All Comments
MrCommunistGen - Thursday, July 25, 2013 - link
YES! I've been excitedly waiting for this review since the announcement!Byte - Thursday, July 25, 2013 - link
Writes for the 120GB are still quite slow.chizow - Thursday, July 25, 2013 - link
That's nearly universal though for all the entry-level capacity SSDs on the market, it's similar to RAID 0, when you can write to symmetrical NAND packages you see a significant increase in write speeds.OUT FOX EM - Monday, July 29, 2013 - link
Speaking of RAID 0, if you'll notice, all the drives of 250GB and higher perform around the same. You are MUCH better off getting 4x250GB drives instead of the 1TB. With most models the cost will actually be about the same, but the speed of the RAID will be 4x faster as well while maintaining the same capacity.Of course there are other drawbacks like space inside your PC and amount of available SATA ports on your motherboard, for instance, but if those aren't a factor, buying multiple SSD's is a much better option in terms of performance. I don't see many reviews mention this fact.
Jorgisven - Thursday, August 1, 2013 - link
Much better in terms of performance, but I wouldn't recommend RAID 0 for 4 SSD hard drives. RAID6 is likely a better option, as it is fault tolerant without losing too much space. It's a bit of a personal decision, but the RAID concepts stand true whether it's SSD or not. Additionally, 4x250 is likely a good percentage more expensive than the already expensive 1TB SSD.Democrab - Thursday, August 15, 2013 - link
I'm not sure about you, but I'm only storing replaceable data on my SSDs...There are game saves but they're automatically put on Google Drive too so I get backups easily, it's easy to set something like that up and then just get the benefits of RAID0 although I'd be using a RAID card as the chipset would likely bottleneck it.yut345 - Thursday, December 12, 2013 - link
I agree. Due to the volatile nature of SSDs, and the fact that if they go down your data can't really be recovered like it could be on mechanical drive, I do not plan to store anything on the drive that I don't also back up somewhere else.m00dawg - Friday, August 23, 2013 - link
With only 4 drives, a RAID10 would be much preferable. 1/2 the available space (same as a 4 drive RAID6 in this case), but without the need to calculate parity, worry (as much) about partitioning alignment, and you can still handle up to 2 drive failures (though only if they are on different stripes).fallaha56 - Friday, September 19, 2014 - link
sorry but disagree this will defeat the point unless you're on a top-end raid controller -and then you get no TRIMwhen there's no moving parts reliability becomes much less of an issue, esp for an OS drive with cloud and local backup like most of us high-end users do
Stas - Tuesday, September 24, 2013 - link
That's what I did for the recent laser data processing builds. 4x250GB 840s and a 1TB HDD for nightly backup. Only data is stored on the array. Speeds are up to 1600MB/sec. Needless to say, the client is very happy :)