Kingston SSDNow V300 (120GB & 240GB) Review
by Kristian Vättö on April 30, 2013 12:30 PM ESTPerformance Consistency
In our Intel SSD DC S3700 review Anand introduced a new method of characterizing performance: looking at the latency of individual operations over time. The S3700 promised a level of performance consistency that was unmatched in the industry, and as a result needed some additional testing to show that. The reason we don't have consistent IO latency with SSDs is because inevitably all controllers have to do some amount of defragmentation or garbage collection in order to continue operating at high speeds. When and how an SSD decides to run its defrag and cleanup routines directly impacts the user experience. Frequent (borderline aggressive) cleanup generally results in more stable performance, while delaying that can result in higher peak performance at the expense of much lower worst case performance. The graphs below tell us a lot about the architecture of these SSDs and how they handle internal defragmentation.
To generate the data below I took a freshly secure erased SSD and filled it with sequential data. This ensures that all user accessible LBAs have data associated with them. Next I kicked off a 4KB random write workload across all LBAs at a queue depth of 32 using incompressible data. I ran the test for just over half an hour, no where near what we run our steady state tests for but enough to give me a good look at drive behavior once all spare area filled up.
I recorded instantaneous IOPS every second for the duration of the test. I then plotted IOPS vs. time and generated the scatter plots below. Each set of graphs features the same scale. The first two sets use a log scale for easy comparison, while the last set of graphs uses a linear scale that tops out at 40K IOPS for better visualization of differences between drives.
The high level testing methodology remains unchanged from our S3700 review. Unlike in previous reviews however, I did vary the percentage of the drive that I filled/tested depending on the amount of spare area I was trying to simulate. The buttons are labeled with the advertised user capacity had the SSD vendor decided to use that specific amount of spare area. If you want to replicate this on your own all you need to do is create a partition smaller than the total capacity of the drive and leave the remaining space unused to simulate a larger amount of spare area. The partitioning step isn't absolutely necessary in every case but it's an easy way to make sure you never exceed your allocated spare area. It's a good idea to do this from the start (e.g. secure erase, partition, then install Windows), but if you are working backwards you can always create the spare area partition, format it to TRIM it, then delete the partition. Finally, this method of creating spare area works on the drives we've tested here but not all controllers may behave the same way.
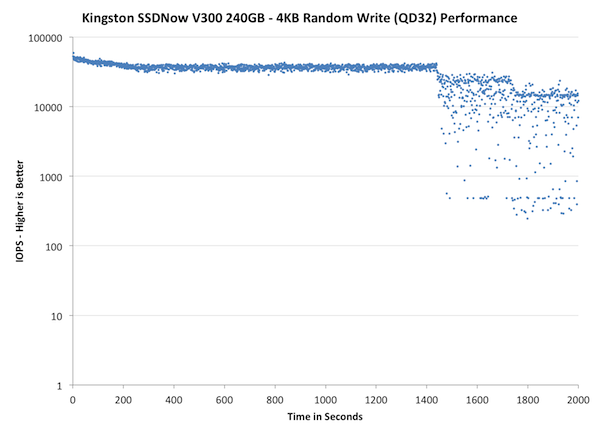
The first set of graphs shows the performance data over the entire 2000 second test period. In these charts you'll notice an early period of very high performance followed by a sharp dropoff. What you're seeing in that case is the drive allocating new blocks from its spare area, then eventually using up all free blocks and having to perform a read-modify-write for all subsequent writes (write amplification goes up, performance goes down).
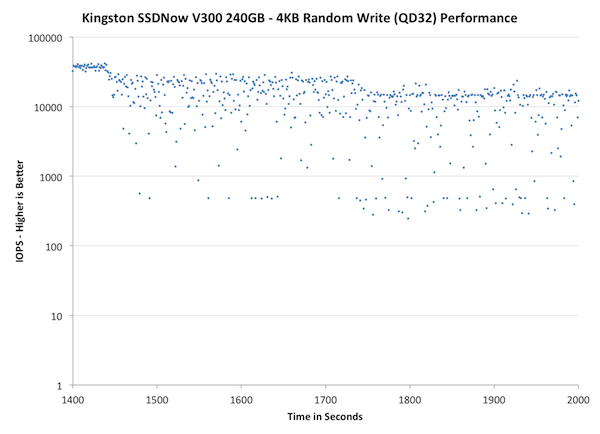
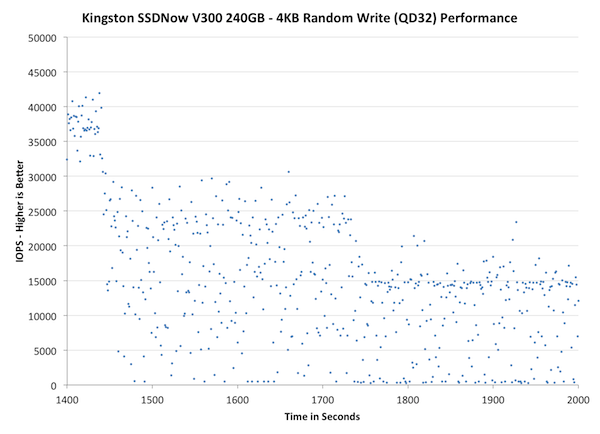
The second set of graphs zooms in to the beginning of steady state operation for the drive (t=1400s). The third set also looks at the beginning of steady state operation but on a linear performance scale. Click the buttons below each graph to switch source data.
| Impact of Spare Area | ||||||||
| Kingston SSDNow V300 240GB | Intel SSD DC S3700 200GB | Intel SSD 335 240GB | Corsair Neutron 240GB | OCZ Vector 256GB | Samsung SSD 840 Pro 256GB | |||
|
Default |
||||||||
| 25% Spare Area | - | - | ||||||
IO consistency has always been good in SandForce based SSDs. The V300 actually behaves a bit differently from Intel SSD 335 as it takes longer for it to enter steady-state (1400s vs 800s) but on the other hand, the IOPS also drops more in steady-state compared to Intel. For consumer workloads, I believe pushing the steady-state back might not be a bad idea because it's unlikely that the SSD will even reach steady-state, so you'll get better performance at the state where the SSD will be used in.
| Impact of Spare Area | ||||||||
| Kingston SSDNow V300 240GB | Intel SSD DC S3700 200GB | Intel SSD 335 240GB | Corsair Neutron 240GB | OCZ Vector 256GB | Samsung SSD 840 Pro 256GB | |||
| Default | ||||||||
| 25% Spare Area | - | - | ||||||
The difference between V300 and SSD 335 is quite dramatic here. The IOPS of V300 drops to near zero in the worst cases, whereas for the SSD 335 it stays at over 7K at all times. What's surprising is that giving the V300 more OP doesn't actually help at all. I'm not sure why that's happening but SandForce has always behaved weirdly when it comes to steady-state due to the compression.
| Impact of Spare Area | ||||||||
| Kingston SSDNow V300 240GB | Intel SSD DC S3700 200GB | Intel SSD 335 240GB | Corsair Neutron 240GB | OCZ Vector 256GB | Samsung SSD 840 Pro 256GB | |||
| Default | ||||||||
| 25% Spare Area | - | - | ||||||


43 Comments
View All Comments
blackmagnum - Tuesday, April 30, 2013 - link
Kingston have the brand image to succeed in this market but their product lack the unique selling point. They are just commodities like their ram sticks.Kristian Vättö - Tuesday, April 30, 2013 - link
Which is exactly the point I was trying to raise. Kingston has a decent image and their distribution system is broad but their products are not unique. They shouldn't have a problem surviving in the market but they won't be able to grab any major marketshare either.UltraTech79 - Tuesday, April 30, 2013 - link
I don't think their goal is to grab major market share. Its to maintain and secure their current market share.Diagrafeas - Tuesday, April 30, 2013 - link
Which firmware did the drives have?I bought two 120GB ones a week apart.
The first has 505 and the second 506.
The 506 is way slower...even at booting Windows.
I'll post some numbers later...
Kristian Vättö - Tuesday, April 30, 2013 - link
The 120GB I have is 505. I don't have the 240GB anymore but I'm pretty confident it's 505 too as I received it a couple of months ago so it's not exactly new.Diagrafeas - Thursday, May 2, 2013 - link
Both are on SATA 2AS SSD Benchmark Scores 505-506(Read,Write)
Seq256-175 , 158-133
4K 14-11 , 45-26
4K-64
Diagrafeas - Thursday, May 2, 2013 - link
4K-64 123-91 , 109-114Acc. Time 0.138-0.195 , 0.321-0.405
Pyrostemplar - Tuesday, April 30, 2013 - link
On the second table - Kingston SSDNow V300 Specifications - performance drops as capacity increases, something that being correct is completely new in terms of SSDs. AFAIK in every SSD the higher capacity ones have the same or greater performance than lower capacity ones (of the same model, of course). C&P mistake?Kristian Vättö - Tuesday, April 30, 2013 - link
Nope, it's not a mistake (unless Kingston's datasheet is wrong):http://www.kingston.com/datasheets/sv300s3_us.pdf
mike55 - Tuesday, April 30, 2013 - link
The images on page 3 aren't working for me.Is there any significant difference in the msachi drivers compared to intel rst? Is it worth installing the intel ones when using an SSD?