Corsair Neutron & Neutron GTX: All Capacities Tested
by Kristian Vättö on December 19, 2012 1:10 PM ESTAnandTech Storage Bench 2011
Last year we introduced our AnandTech Storage Bench, a suite of benchmarks that took traces of real OS/application usage and played them back in a repeatable manner. Anand assembled the traces out of frustration with the majority of what we have today in terms of SSD benchmarks.
Although the AnandTech Storage Bench tests did a good job of characterizing SSD performance, they weren't stressful enough. All of the tests performed less than 10GB of reads/writes and typically involved only 4GB of writes specifically. That's not even enough exceed the spare area on most SSDs. Most canned SSD benchmarks don't even come close to writing a single gigabyte of data, but that doesn't mean that simply writing 4GB is acceptable.
Originally we kept the benchmarks short enough that they wouldn't be a burden to run (~30 minutes) but long enough that they were representative of what a power user might do with their system. Later, however, we created what we refer to as the Mother of All SSD Benchmarks (MOASB). Rather than only writing 4GB of data to the drive, this benchmark writes 106.32GB. This represents the load you'd put on a drive after nearly two weeks of constant usage. And it takes a long time to run.
1) The MOASB, officially called AnandTech Storage Bench 2011—Heavy Workload, mainly focuses on the times when your I/O activity is the highest. There is a lot of downloading and application installing that happens during the course of this test. Our thinking was that it's during application installs, file copies, downloading, and multitasking with all of this that you can really notice performance differences between drives.
2) We tried to cover as many bases as possible with the software incorporated into this test. There's a lot of photo editing in Photoshop, HTML editing in Dreamweaver, web browsing, game playing/level loading (Starcraft II and WoW are both a part of the test), as well as general use stuff (application installing, virus scanning). We included a large amount of email downloading, document creation, and editing as well. To top it all off we even use Visual Studio 2008 to build Chromium during the test.
The test has 2,168,893 read operations and 1,783,447 write operations. The IO breakdown is as follows:
| AnandTech Storage Bench 2011—Heavy Workload IO Breakdown | ||||
| IO Size | % of Total | |||
| 4KB | 28% | |||
| 16KB | 10% | |||
| 32KB | 10% | |||
| 64KB | 4% | |||
Only 42% of all operations are sequential; the rest ranges from pseudo to fully random (with most falling in the pseudo-random category). Average queue depth is 4.625 IOs, with 59% of operations taking place in an IO queue of 1.
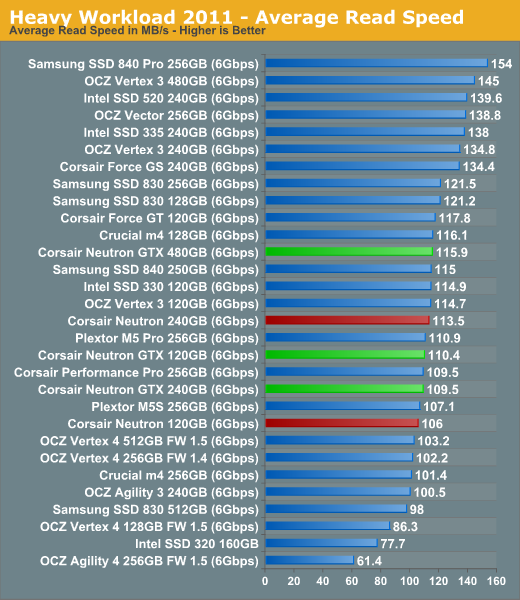
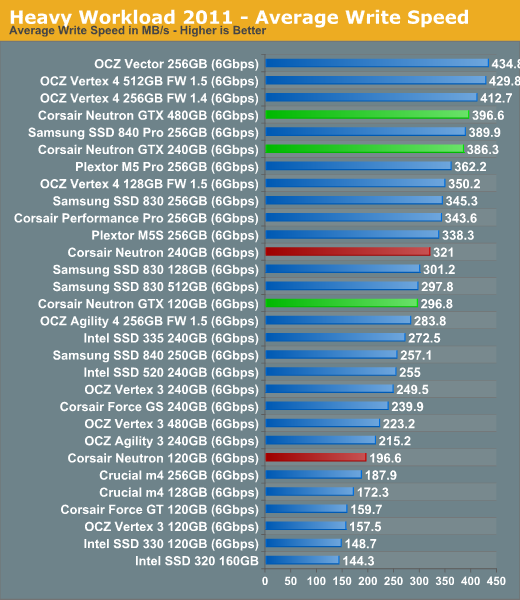
Many of you have asked for a better way to really characterize performance. Simply looking at IOPS doesn't really say much. As a result we're going to be presenting Storage Bench 2011 data in a slightly different way. We'll have performance represented as Average MB/s, with higher numbers being better. At the same time we'll be reporting how long the SSD was busy while running this test. These disk busy graphs will show you exactly how much time was shaved off by using a faster drive vs. a slower one during the course of this test. Finally, we will also break out performance into reads, writes, and combined. The reason we do this is to help balance out the fact that this test is unusually write intensive, which can often hide the benefits of a drive with good read performance.
There's also a new light workload for 2011. This is a far more reasonable, typical every day use case benchmark. It has lots of web browsing, photo editing (but with a greater focus on photo consumption), video playback, as well as some application installs and gaming. This test isn't nearly as write intensive as the MOASB but it's still multiple times more write intensive than what we were running last year.
We don't believe that these two benchmarks alone are enough to characterize the performance of a drive, but hopefully along with the rest of our tests they will help provide a better idea. The testbed for Storage Bench 2011 has changed as well. We're now using a Sandy Bridge platform with full 6Gbps support for these tests.
AnandTech Storage Bench 2011—Heavy Workload
We'll start out by looking at average data rate throughout our new heavy workload test:
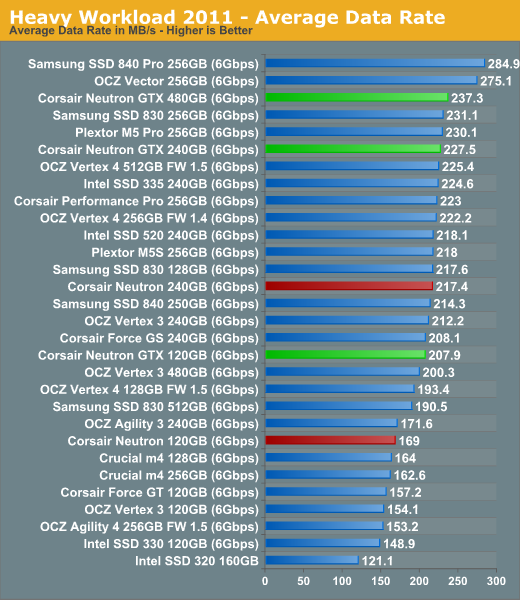
The 480GB Neutron GTX enjoys a small speed increase over the 240GB version but in general the overall performance follows the same pattern as our synthetic tests. The only truly significant difference in performance is between the 120GB models where the Neutron GTX beats the regular Neutron by 23%. Neutron GTX is actually a very high performer at 120GB although I have to note that we have not tested the 128GB version of Samsung SSD 840 Pro and OCZ Vector yet.
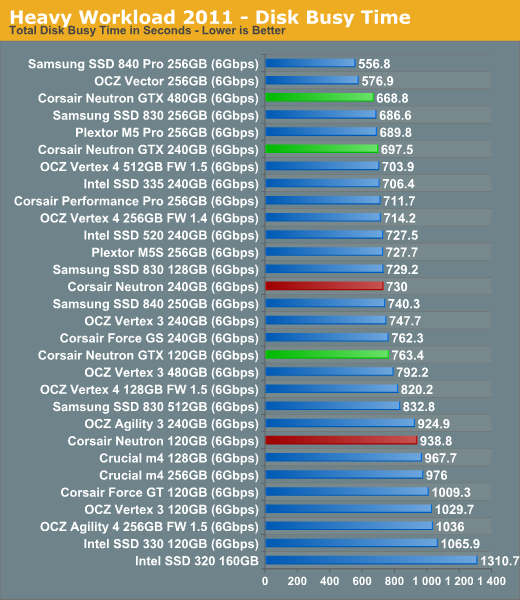
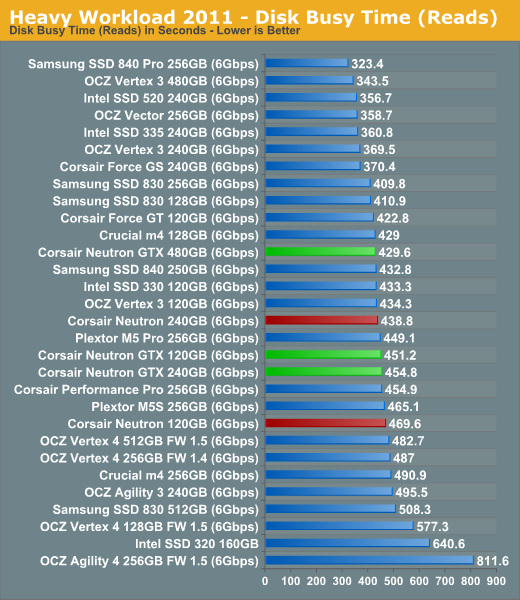
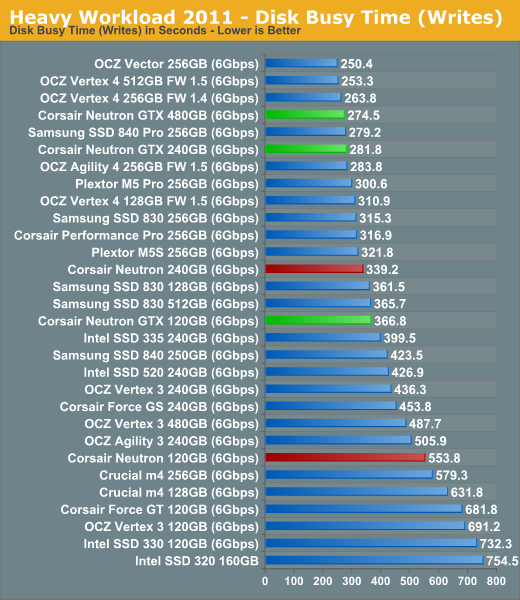
The next three charts just represent the same data, but in a different manner. Instead of looking at average data rate, we're looking at how long the disk was busy for during this entire test. Note that disk busy time excludes any and all idles, this is just how long the SSD was busy doing something:


44 Comments
View All Comments
Sabresiberian - Wednesday, December 19, 2012 - link
Always glad to see someone step in with a different controller than the majority have, and see it perform very well. Good job Corsair!I have to say, the price/performance is excellent and I'm very tempted to replace the 840 Pro as the choice for my next build. That being said, what I really hope it does at this point is cause Samsung to drop the price of the 840 Pro lineup.
extide - Wednesday, December 19, 2012 - link
I wouldn't expect much of any change-up in the market as these drives have already been out for a few months. They are not brand new at this point.Sabresiberian - Thursday, December 20, 2012 - link
Heh well I wasn't implying there would or even should be any kind of change-up, I'm just saying I want competition to stay alive as long as possible, and if everyone jumps onto one controller from one source the only competition point will more rapidly come down to just price.The differences are basically controller, NAND, and price, in today's consumer market, and frankly I'd like to see controllers in particular get a lot better. They are good at pumping out high peak numbers, but consistency and even reliability just aren't there yet, in my opinion. (I mean reliability in terms of getting a bug-free controller, not in terms of life of the SSD.)
Flying Goat - Thursday, January 3, 2013 - link
Hmmm...The Samsung 840 Pro 512GB has dropped by at least $100 in the past month. Not making any claims about the reason for that.Drazick - Wednesday, December 19, 2012 - link
Hi,Why don't you update your Google+ Page?
Thank You.
nathanddrews - Thursday, December 20, 2012 - link
What's Google+?Snotling - Thursday, December 20, 2012 - link
google it, you'll know.Sabresiberian - Thursday, December 20, 2012 - link
Google+ is an even less secure version of Facebook.If you like Google laying claim to every word you say, then by all means sign up for it.
blanarahul - Wednesday, December 19, 2012 - link
When are you going to review lower capacity models of 840 Pro and 840?Nice review though.
Kristian Vättö - Thursday, December 20, 2012 - link
I have a 128GB and 512GB 840 Pros but we are still waiting for additional 840 capacities.