OCZ Agility 4 (256GB) Review
by Kristian Vättö on September 1, 2012 1:00 PM ESTAnandTech Storage Bench 2011
Last year we introduced our AnandTech Storage Bench, a suite of benchmarks that took traces of real OS/application usage and played them back in a repeatable manner. Anand assembled the traces out of frustration with the majority of what we have today in terms of SSD benchmarks.
Although the AnandTech Storage Bench tests did a good job of characterizing SSD performance, they weren't stressful enough. All of the tests performed less than 10GB of reads/writes and typically involved only 4GB of writes specifically. That's not even enough exceed the spare area on most SSDs. Most canned SSD benchmarks don't even come close to writing a single gigabyte of data, but that doesn't mean that simply writing 4GB is acceptable.
Originally we kept the benchmarks short enough that they wouldn't be a burden to run (~30 minutes) but long enough that they were representative of what a power user might do with their system. Later, however, we created what we refer to as the Mother of All SSD Benchmarks (MOASB). Rather than only writing 4GB of data to the drive, this benchmark writes 106.32GB. This represents the load you'd put on a drive after nearly two weeks of constant usage. And it takes a long time to run.
1) The MOASB, officially called AnandTech Storage Bench 2011—Heavy Workload, mainly focuses on the times when your I/O activity is the highest. There is a lot of downloading and application installing that happens during the course of this test. Our thinking was that it's during application installs, file copies, downloading, and multitasking with all of this that you can really notice performance differences between drives.
2) We tried to cover as many bases as possible with the software incorporated into this test. There's a lot of photo editing in Photoshop, HTML editing in Dreamweaver, web browsing, game playing/level loading (Starcraft II and WoW are both a part of the test), as well as general use stuff (application installing, virus scanning). We included a large amount of email downloading, document creation, and editing as well. To top it all off we even use Visual Studio 2008 to build Chromium during the test.
The test has 2,168,893 read operations and 1,783,447 write operations. The IO breakdown is as follows:
| AnandTech Storage Bench 2011—Heavy Workload IO Breakdown | ||||
| IO Size | % of Total | |||
| 4KB | 28% | |||
| 16KB | 10% | |||
| 32KB | 10% | |||
| 64KB | 4% | |||
Only 42% of all operations are sequential; the rest ranges from pseudo to fully random (with most falling in the pseudo-random category). Average queue depth is 4.625 IOs, with 59% of operations taking place in an IO queue of 1.
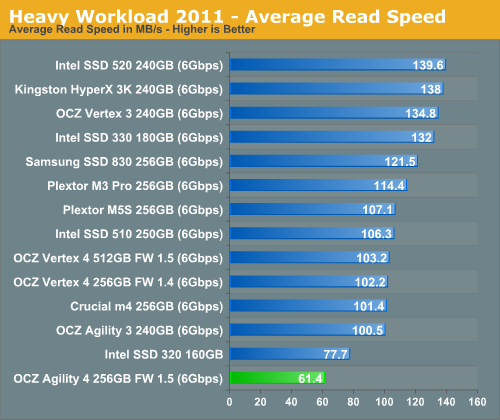
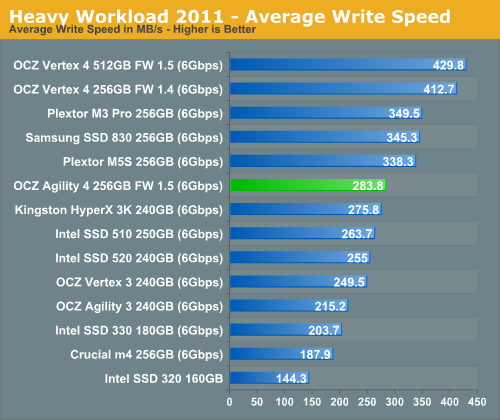
Many of you have asked for a better way to really characterize performance. Simply looking at IOPS doesn't really say much. As a result we're going to be presenting Storage Bench 2011 data in a slightly different way. We'll have performance represented as Average MB/s, with higher numbers being better. At the same time we'll be reporting how long the SSD was busy while running this test. These disk busy graphs will show you exactly how much time was shaved off by using a faster drive vs. a slower one during the course of this test. Finally, we will also break out performance into reads, writes, and combined. The reason we do this is to help balance out the fact that this test is unusually write intensive, which can often hide the benefits of a drive with good read performance.
There's also a new light workload for 2011. This is a far more reasonable, typical every day use case benchmark. It has lots of web browsing, photo editing (but with a greater focus on photo consumption), video playback, as well as some application installs and gaming. This test isn't nearly as write intensive as the MOASB but it's still multiple times more write intensive than what we were running last year.
We don't believe that these two benchmarks alone are enough to characterize the performance of a drive, but hopefully along with the rest of our tests they will help provide a better idea. The testbed for Storage Bench 2011 has changed as well. We're now using a Sandy Bridge platform with full 6Gbps support for these tests.
AnandTech Storage Bench 2011—Heavy Workload
We'll start out by looking at average data rate throughout our new heavy workload test:
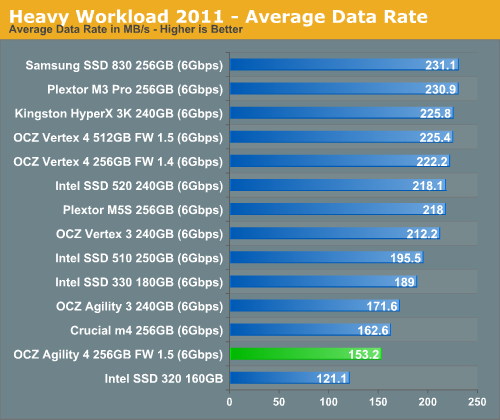
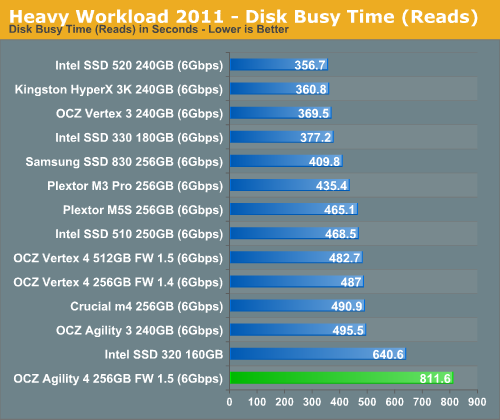
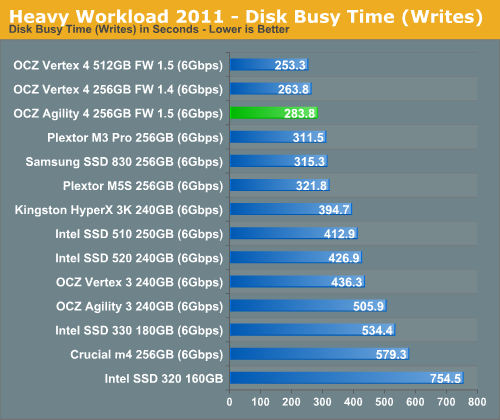
After going through all of our synthetic benchmarks, it shouldn't come as a surprise that the Agility 4 does not excel in our Storage Suites. Average write speed is fine, but read speed is from SATA 3Gbps era. Since the majority of IO operations of our Heavy suite are reads, the Agility 4 is slower than any other recent SATA 6Gbps SSD we have tested.
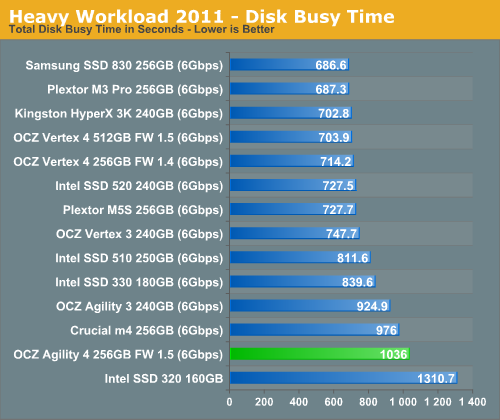
The next three charts just represent the same data, but in a different manner. Instead of looking at average data rate, we're looking at how long the disk was busy for during this entire test. Note that disk busy time excludes any and all idles; this is just how long the SSD was busy doing something:


41 Comments
View All Comments
MadMan007 - Saturday, September 1, 2012 - link
Given that performance mode significantly affects HDTach, it might be useful to run some of the other broad tests like AnandTech Storage Bench with a drive that's more full. The results posted for that test may reflect the 'ideal' performance of a drive that isn't very full, and I can imagine most users would at least reach the second performance plateau with a drive that's actually being used to store OS and applications, if not the third tier. If so it could make quite a difference in the results.Alexvrb - Saturday, September 1, 2012 - link
I second this. Why would I buy a drive with more than twice the capacity I need, when the drives will just be outdated junk in a couple of years? I'd like to see the real-world performance of these SSDs after they've been filled over 50%.rs2 - Sunday, September 2, 2012 - link
Third.'Performance mode' is a hack and a gimmick. The drive suddenly loses 50% of its performance as soon as it 25% full. And then another 60% of what's left if you go past 80%. That's just absurd. While many users may well stay under the 80% capacity mark, very few will stay under 25% long-term.
Any benchmarks of this drive should be done at a minimum of 25% capacity to better reflect the real-world performance that most users will see.
semo - Monday, September 3, 2012 - link
This is your standard bait and switch sale tactic from OCZ but at least they are more upfront about it this time. When they swapped the innards of the Vertex 2 and completely changed the specs (both performance and capacity, for the worse) they never told anyone.Anand was even reluctant to report on this shifty marketing practices but eventually caved in, only to have OCZ say sorry and not issue a mass recall...
Craigster586 - Sunday, November 11, 2012 - link
My Vertex 3 120gb is around 75% capacity. After reading your post I ran a Disc Benchmark using the latest Pass Mark software. With 8 programs running and 4 downloads My overall result was 2296. with 220MB/s Read and 215 MB/s write. Taking into consideration I'm at about 3/4 capacity running 8 programs with multiple downloads. I think my SSD is Performing quite well. Im not gonna say I'm not lucky. These drives are known to crash I bought it knowingly But I've had mine since they been on the market and havn't had a single issue. However i did update my SSD's firmware to the latest edition again thats at your own risk but it worked for me with no issues.Craigster586 - Sunday, November 11, 2012 - link
Vertex 3 120Gb PassMark Disc Bench MarkDisk Mark
#1 - Seagate ST3300622AS (300GB) 456.4
#2 - WDC WD5000AAKS-00V1A0 (500GB) 580
#3 - Seagate ST31000528AS (1TB) 709
#4 - SAMSUNG MZ7PC064HADR-000 (64GB) 2846
#5 - SAMSUNG HD103SJ (1TB) 850
#6 - INTEL SSDSC2CW240A3 (240GB) 3434
This Computer 2296
Disk - Sequential Read
#1 - Seagate ST3300622AS (300GB) 62.0
#2 - WDC WD5000AAKS-00V1A0 (500GB) 78.4
#3 - Seagate ST31000528AS (1TB) 100.4
#4 - SAMSUNG MZ7PC064HADR-000 (64GB) 461.9
#5 - SAMSUNG HD103SJ (1TB) 118.5
#6 - INTEL SSDSC2CW240A3 (240GB) 393.6
This Computer 220.4
Disk - Sequential Write
#1 - Seagate ST3300622AS (300GB) 61.2
#2 - WDC WD5000AAKS-00V1A0 (500GB) 78.5
#3 - Seagate ST31000528AS (1TB) 90.9
#4 - SAMSUNG MZ7PC064HADR-000 (64GB) 155.4
#5 - SAMSUNG HD103SJ (1TB) 112.3
#6 - INTEL SSDSC2CW240A3 (240GB) 225.4
This Computer 216.8
Disk - Random Seek + RW
#1 - Seagate ST3300622AS (300GB) 2.94
#2 - WDC WD5000AAKS-00V1A0 (500GB) 3.58
#3 - Seagate ST31000528AS (1TB) 4.80
#4 - SAMSUNG MZ7PC064HADR-000 (64GB) 169.6
#5 - SAMSUNG HD103SJ (1TB) 4.13
#6 - INTEL SSDSC2CW240A3 (240GB) 330.6
This Computer 197.7
akumaburn - Tuesday, December 11, 2012 - link
That is true.. however..The drive recovers its performance afterwards. What they mean is that if you all the sudden wrote 120GB of data unto their 256GB drive the performance of your drive will drop to about half-this is normal. Give it a few hours of idle time, do a trim and reboot and you're back up to 100%.
I have a vertex 4 and can vouch for this, it does slow down, but if you give it a few hours for its internal space management to do its thing it will speed up again to near 100% performance.
LB-ID - Tuesday, September 4, 2012 - link
A fool and his money are soon parted, and anyone who buys an SSD from OCZ is a fool. They treat their customers like beta testers, and mock them when they have issues. No thanks, I'll stick to far more reliable products from far more reliable companies.ashrafi - Saturday, September 1, 2012 - link
Nice article ,at the end ,
"agility 4 for significantly less than the Crucial m4 of Samsung SSD 830 "
little correction
"agility 4 for significantly less than the Crucial m4 or Samsung SSD 830 "
Kristian Vättö - Saturday, September 1, 2012 - link
Fixed! Thanks for the heads up :-)