Corsair Neutron GTX SSD Review (240GB): Link A Media Controller Tested
by Anand Lal Shimpi on August 20, 2012 6:00 AM EST- Posted in
- Storage
- SSDs
- Corsair
- Neutron
- Link a Media
AnandTech Storage Bench 2011
Two years ago we introduced our AnandTech Storage Bench, a suite of benchmarks that took traces of real OS/application usage and played them back in a repeatable manner. I assembled the traces myself out of frustration with the majority of what we have today in terms of SSD benchmarks.
Although the AnandTech Storage Bench tests did a good job of characterizing SSD performance, they weren't stressful enough. All of the tests performed less than 10GB of reads/writes and typically involved only 4GB of writes specifically. That's not even enough exceed the spare area on most SSDs. Most canned SSD benchmarks don't even come close to writing a single gigabyte of data, but that doesn't mean that simply writing 4GB is acceptable.
Originally I kept the benchmarks short enough that they wouldn't be a burden to run (~30 minutes) but long enough that they were representative of what a power user might do with their system.
Not too long ago I tweeted that I had created what I referred to as the Mother of All SSD Benchmarks (MOASB). Rather than only writing 4GB of data to the drive, this benchmark writes 106.32GB. It's the load you'd put on a drive after nearly two weeks of constant usage. And it takes a *long* time to run.
1) The MOASB, officially called AnandTech Storage Bench 2011 - Heavy Workload, mainly focuses on the times when your I/O activity is the highest. There is a lot of downloading and application installing that happens during the course of this test. My thinking was that it's during application installs, file copies, downloading and multitasking with all of this that you can really notice performance differences between drives.
2) I tried to cover as many bases as possible with the software I incorporated into this test. There's a lot of photo editing in Photoshop, HTML editing in Dreamweaver, web browsing, game playing/level loading (Starcraft II & WoW are both a part of the test) as well as general use stuff (application installing, virus scanning). I included a large amount of email downloading, document creation and editing as well. To top it all off I even use Visual Studio 2008 to build Chromium during the test.
The test has 2,168,893 read operations and 1,783,447 write operations. The IO breakdown is as follows:
| AnandTech Storage Bench 2011 - Heavy Workload IO Breakdown | ||||
| IO Size | % of Total | |||
| 4KB | 28% | |||
| 16KB | 10% | |||
| 32KB | 10% | |||
| 64KB | 4% | |||
Only 42% of all operations are sequential, the rest range from pseudo to fully random (with most falling in the pseudo-random category). Average queue depth is 4.625 IOs, with 59% of operations taking place in an IO queue of 1.
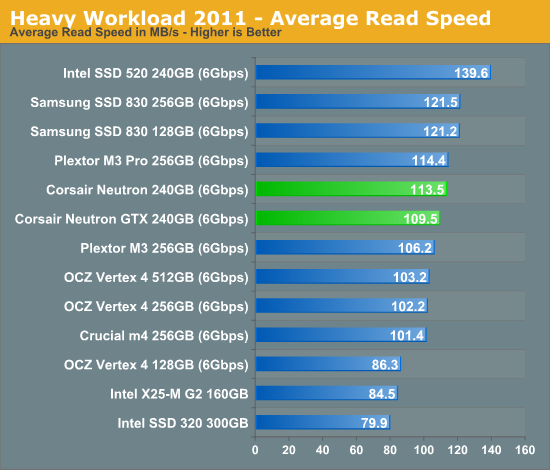
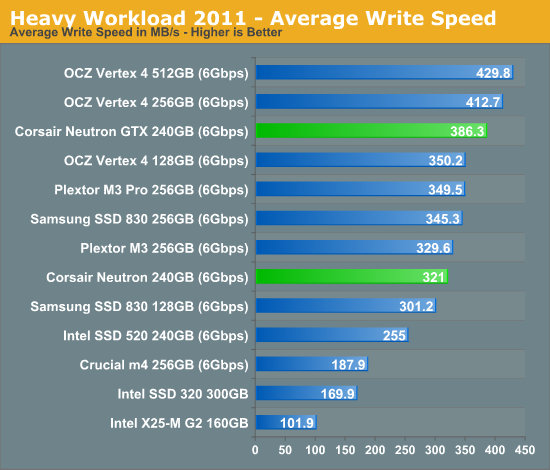
Many of you have asked for a better way to really characterize performance. Simply looking at IOPS doesn't really say much. As a result I'm going to be presenting Storage Bench 2011 data in a slightly different way. We'll have performance represented as Average MB/s, with higher numbers being better. At the same time I'll be reporting how long the SSD was busy while running this test. These disk busy graphs will show you exactly how much time was shaved off by using a faster drive vs. a slower one during the course of this test. Finally, I will also break out performance into reads, writes and combined. The reason I do this is to help balance out the fact that this test is unusually write intensive, which can often hide the benefits of a drive with good read performance.
There's also a new light workload for 2011. This is a far more reasonable, typical every day use case benchmark. Lots of web browsing, photo editing (but with a greater focus on photo consumption), video playback as well as some application installs and gaming. This test isn't nearly as write intensive as the MOASB but it's still multiple times more write intensive than what we were running in 2010.
As always I don't believe that these two benchmarks alone are enough to characterize the performance of a drive, but hopefully along with the rest of our tests they will help provide a better idea.
The testbed for Storage Bench 2011 has changed as well. We're now using a Sandy Bridge platform with full 6Gbps support for these tests.
AnandTech Storage Bench 2011 - Heavy Workload
We'll start out by looking at average data rate throughout our new heavy workload test:
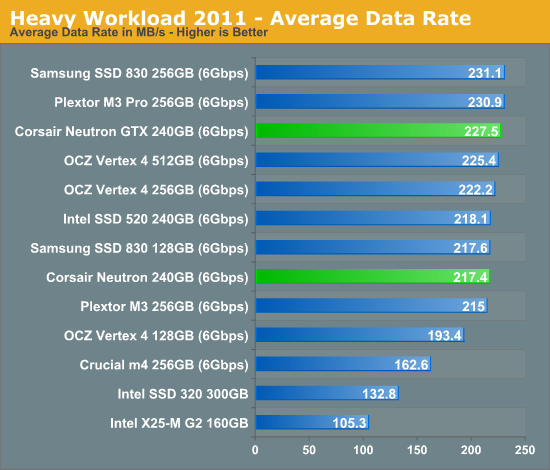
Without a doubt, Corsair's Neutron GTX is among the fastest drives we've tested here. In our most stressful use case, the Neutron GTX doesn't even break a sweat. The standard Neutron isn't too far behind either, the GTX outpaces it by just under 5%.
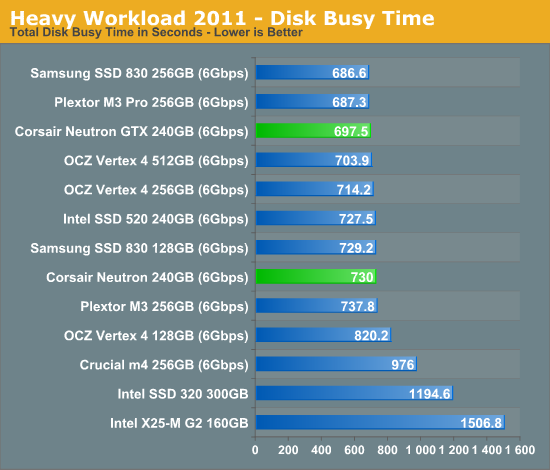
The next three charts just represent the same data, but in a different manner. Instead of looking at average data rate, we're looking at how long the disk was busy for during this entire test. Note that disk busy time excludes any and all idles, this is just how long the SSD was busy doing something:
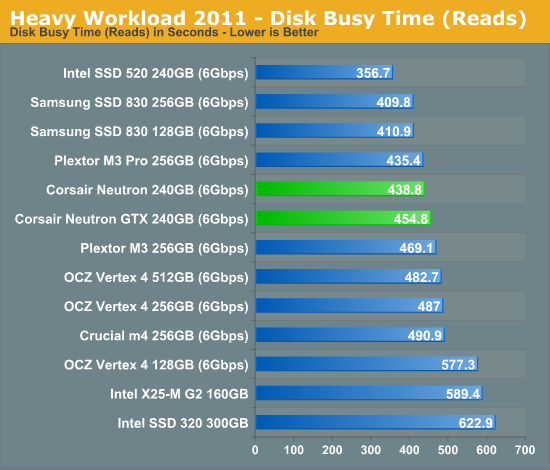
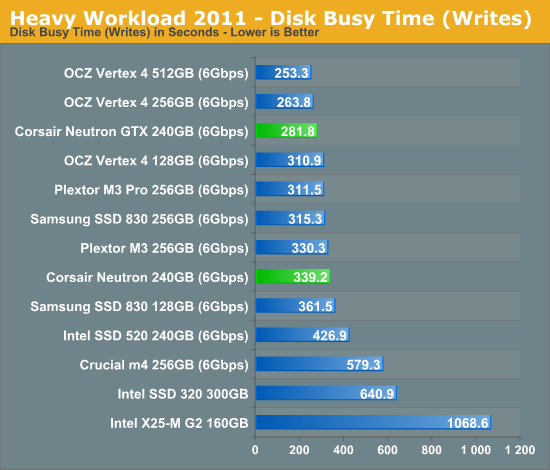


36 Comments
View All Comments
wsjudd - Monday, August 20, 2012 - link
Looks like there's a stray bit of punctuation in here:"The drive is the Neutron, and the controller maker? Link A Media Devices"
AnotherGuy - Monday, August 20, 2012 - link
Really after so much information in the article... thats what you have to say... the Punctuation?I am afraid people wanna see some relevant thoughts and opinions about the info on the article not ur stupid comments on punctuation. These articles are about technology not your English 101 u take at school.
Really tired of the same comments on almost every article.
gmallen - Monday, August 20, 2012 - link
They certainly don't want to see inane, off-topic troll-bait like your comment. If you're so distressed by these comments, don't read them or comment about them. Get a life instead.AnotherGuy - Monday, August 20, 2012 - link
when he or others who post same comments see my insane comment, they might realize that they are actually annoying and stop doing it.Mr. Pedantic - Monday, August 20, 2012 - link
We can only hope you will recognise the same thing and stop posting useless rubbish.seapeople - Monday, August 20, 2012 - link
Not to feed the trolls, but I agree with this troll somewhat. The proposed punctuation correction wasn't even necessarily correct.Rishi100 - Monday, August 20, 2012 - link
Let it be so.... attractive, that I jump on my second SSD.Bmadd89 - Monday, August 20, 2012 - link
On page 1 you comment saying the DRAM in the Neutron is 256MB but in the graph its 128MBXZerg - Monday, August 20, 2012 - link
I would really suggest that you keep the contenders consistent across all the benches/tests. It just feels wrong to see Product X in few benches and then missing in other, point in case OCZ products missing in the power consumption. I am sure that you have their numbers but for some reason those are skipped.mayankleoboy1 - Monday, August 20, 2012 - link
with many controllers tying at ~ 500MBPS, are we reaching the theoretical speeds of NAND flash? Meaning controllers can get better, but speeds wont increase much?What are the theoretical speeds of NAND flash?