ADATA XPG SX900 (128GB) Review: Maximizing SandForce Capacity
by Kristian Vättö on June 8, 2012 1:25 AM ESTAnandTech Storage Bench 2011
Last year we introduced our AnandTech Storage Bench, a suite of benchmarks that took traces of real OS/application usage and played them back in a repeatable manner. Anand assembled the traces out of frustration with the majority of what we have today in terms of SSD benchmarks.
Although the AnandTech Storage Bench tests did a good job of characterizing SSD performance, they weren't stressful enough. All of the tests performed less than 10GB of reads/writes and typically involved only 4GB of writes specifically. That's not even enough exceed the spare area on most SSDs. Most canned SSD benchmarks don't even come close to writing a single gigabyte of data, but that doesn't mean that simply writing 4GB is acceptable.
Originally we kept the benchmarks short enough that they wouldn't be a burden to run (~30 minutes) but long enough that they were representative of what a power user might do with their system. Later, however, we created what we refer to as the Mother of All SSD Benchmarks (MOASB). Rather than only writing 4GB of data to the drive, this benchmark writes 106.32GB. This represents the load you'd put on a drive after nearly two weeks of constant usage. And it takes a long time to run.
1) The MOASB, officially called AnandTech Storage Bench 2011—Heavy Workload, mainly focuses on the times when your I/O activity is the highest. There is a lot of downloading and application installing that happens during the course of this test. Our thinking was that it's during application installs, file copies, downloading, and multitasking with all of this that you can really notice performance differences between drives.
2) We tried to cover as many bases as possible with the software incorporated into this test. There's a lot of photo editing in Photoshop, HTML editing in Dreamweaver, web browsing, game playing/level loading (Starcraft II and WoW are both a part of the test), as well as general use stuff (application installing, virus scanning). We included a large amount of email downloading, document creation, and editing as well. To top it all off we even use Visual Studio 2008 to build Chromium during the test.
The test has 2,168,893 read operations and 1,783,447 write operations. The IO breakdown is as follows:
| AnandTech Storage Bench 2011—Heavy Workload IO Breakdown | ||||
| IO Size | % of Total | |||
| 4KB | 28% | |||
| 16KB | 10% | |||
| 32KB | 10% | |||
| 64KB | 4% | |||
Only 42% of all operations are sequential; the rest ranges from pseudo to fully random (with most falling in the pseudo-random category). Average queue depth is 4.625 IOs, with 59% of operations taking place in an IO queue of 1.
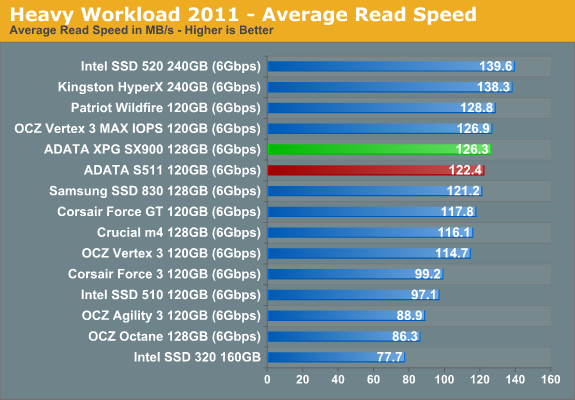
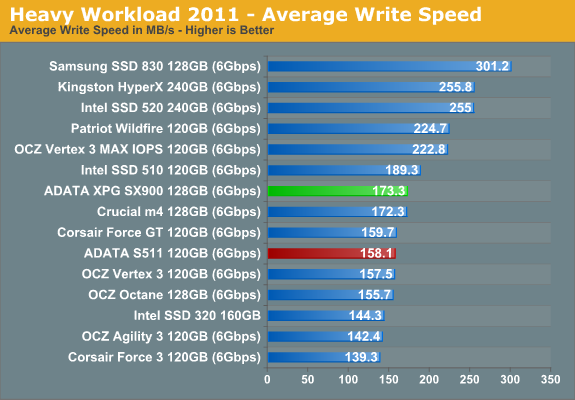
Many of you have asked for a better way to really characterize performance. Simply looking at IOPS doesn't really say much. As a result we're going to be presenting Storage Bench 2011 data in a slightly different way. We'll have performance represented as Average MB/s, with higher numbers being better. At the same time we'll be reporting how long the SSD was busy while running this test. These disk busy graphs will show you exactly how much time was shaved off by using a faster drive vs. a slower one during the course of this test. Finally, we will also break out performance into reads, writes, and combined. The reason we do this is to help balance out the fact that this test is unusually write intensive, which can often hide the benefits of a drive with good read performance.
There's also a new light workload for 2011. This is a far more reasonable, typical every day use case benchmark. It has lots of web browsing, photo editing (but with a greater focus on photo consumption), video playback, as well as some application installs and gaming. This test isn't nearly as write intensive as the MOASB but it's still multiple times more write intensive than what we were running last year.
We don't believe that these two benchmarks alone are enough to characterize the performance of a drive, but hopefully along with the rest of our tests they will help provide a better idea. The testbed for Storage Bench 2011 has changed as well. We're now using a Sandy Bridge platform with full 6Gbps support for these tests.
AnandTech Storage Bench 2011 - Heavy Workload
We'll start out by looking at average data rate throughout our new heavy workload test:
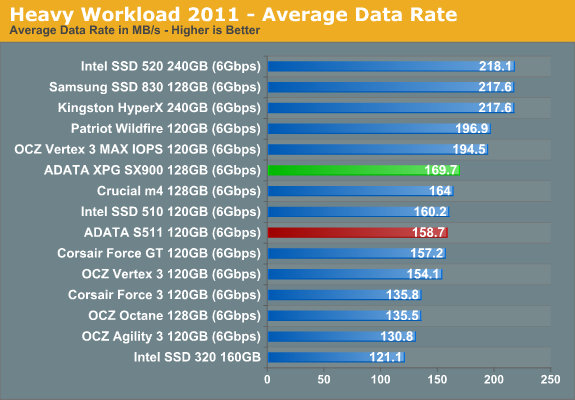
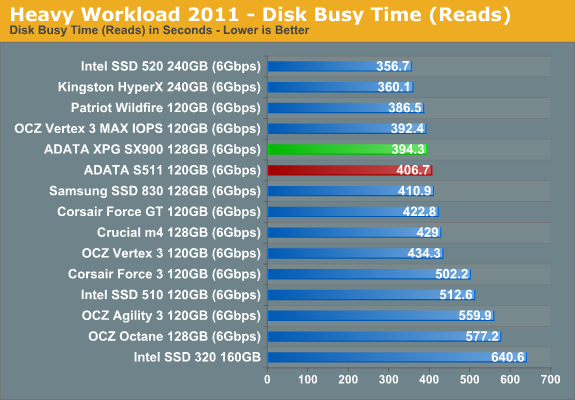
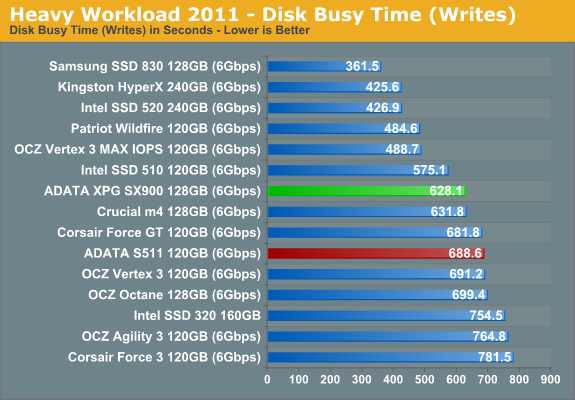
The SX900 is slightly faster than the Vertex 3 and Force GT here, which is most likely due to the newer firmware as I noted in the incompressible sequential read/write speed section. I asked Anand to test a 120GB ADATA S511, which is based on the same SF-2281 controller and utilizes 25nm Intel MLC NAND. The SX900 and S511 should be as similar as possible; however, they don't share the same firmware version. The SX900 is reported to have firmware version 5.0.1 in Device Manager, whereas the S511 Anand tested was running 3.2.2. That's the most current firmware for the S511 and it dates back to November 2011, so this is likely the reason for the difference in performance.
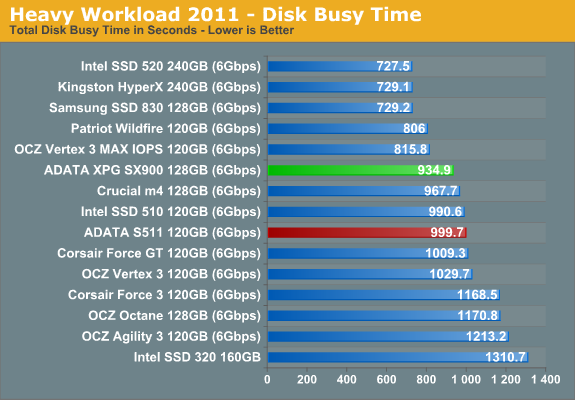
The next three charts just represent the same data, but in a different manner. Instead of looking at average data rate, we're looking at how long the disk was busy for during this entire test. Note that disk busy time excludes any and all idles, this is just how long the SSD was busy doing something:


58 Comments
View All Comments
vol7ron - Friday, June 8, 2012 - link
If you're going to put Mushkin up there, you might as well put OWC there too. Their drives seem to perform fairly well and are priced "decent"Kristian Vättö - Friday, June 8, 2012 - link
I only put Mushkin there because many have been asking for that since it appears to be one of the cheapest brands. OWC is not cheap, in fact even Vertex 3 is cheaper except the 480GB model. The table is endless if I start putting every brand there, plus checking the prices is PITA and already takes a decent amount of time.StevoLincolnite - Friday, June 8, 2012 - link
Plus... Only 4.52% of the worlds population resides in the USA, so the prices are pretty much useless for the 95.48% of the Earths population that doesn't reside in the US.StevoLincolnite - Friday, June 8, 2012 - link
To add to that, I don't mean to belittle your efforts, I just don't bother to look at the pricing on this site.jak3676 - Friday, June 8, 2012 - link
% of world population is hardly a useful stat to toss out there - you could make a decent argument with % of SSD's sold by country/region, but lets face it 99.99% of the world population (to include the US) isn't buying SSDs.If he listed prices in Euro or CAD or Yen or anything else he'd just be favoring that market (which is probably smaller than the US market anyway). Even if he could list prices available by country for the top 10 markets, he'd just turn off all of us as people wouldn't want to scroll through 10x the number of charts.
nathanddrews - Friday, June 8, 2012 - link
4.52% of the world's population, but 22% of the world's GDP. That's why US prices matter.JarredWalton - Friday, June 8, 2012 - link
And let's not forget that our site's primary readership *is* in the USA. I'm not sure of the breakdown, but I'd guess close to half of all our traffic is US based. Even if it's only 1/3 (Kristian for example is based in Finland), I doubt there's any other currency where our listing SSD prices in that denomination would prove more useful to our readers.Jaybus - Friday, June 8, 2012 - link
Yes, but some two thirds of international trades are in US dollars and it is still the de facto exchange currency.Anyway, what difference does it make? The point is relative prices between drives from different manufacturers. I don't think the ratios would change for different currencies.
djboxbaba - Saturday, June 9, 2012 - link
You realize this is a US based website right? and that the majority of the readership is based in the US?Go to a website that caters to your country's currency if this is a problem for you.
lyeoh - Tuesday, June 12, 2012 - link
Useless? Speak for yourself, some of us in the 95.48% know how to do currency conversion.Are you also going to claim the USD prices of oil, gold, silver, CPUs, DRAMs, etc are useless to the rest of the world?
There's plenty of stuff in the world that are priced in US dollars - as in the manufacturer's/producer's main selling price for the item is in US dollars. And the price in other countries is linked to that USD price. When the USD price goes up, their prices go up too.
If the petrodollar loses its hold (its slipping a bit) then it might make sense to use some other currency. That'll be bad for the USA as the US Gov will no longer be able "tax" other countries just by creating more US dollars.