ASRock X79 Extreme9 Review - Price For Performance?
by Ian Cutress on January 24, 2012 2:00 AM EST- Posted in
- Motherboards
- ASRock
- X79
3D Movement Algorithm Test
The algorithms in 3DPM employ both uniform random number generation or normal distribution random number generation, and vary in various amounts of trigonometric operations, conditional statements, generation and rejection, fused operations, etc. The benchmark runs through six algorithms for a specified number of particles and steps, and calculates the speed of each algorithm, then sums them all for a final score. This is an example of a real world situation that a computational scientist may find themselves in, rather than a pure synthetic benchmark. The benchmark is also parallel between particles simulated, and we test the single thread performance as well as the multi-threaded performance.
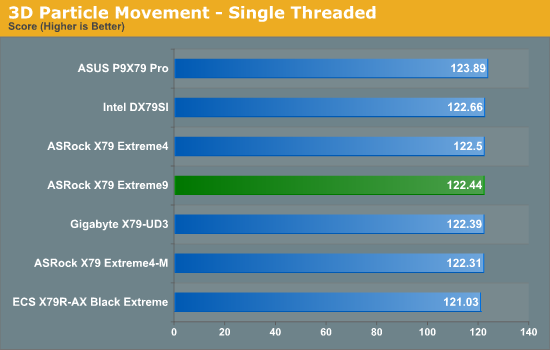
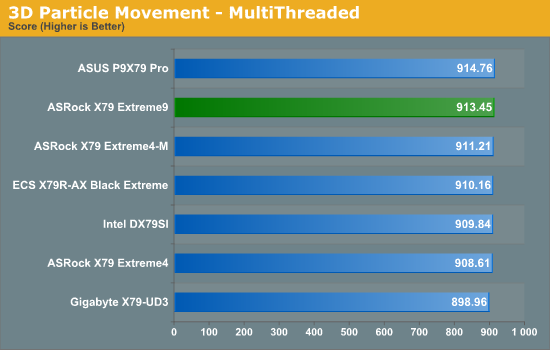
In terms of pure throughput, both single and multi threaded results are reasonable, with multithreading scores in the top half of the X79 table.
WinRAR x64 3.93 - link
With 64-bit WinRAR, we compress the set of files used in the USB speed tests. WinRAR x64 3.93 attempts to use multithreading when possible.
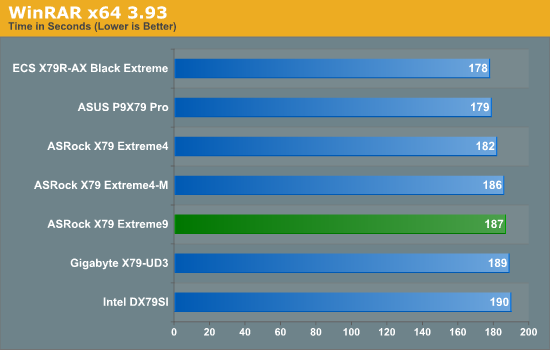
Multithreaded performance doesn't do too well in our WinRAR test, being 9 seconds behind our top board.
FastStone Image Viewer 4.2 - link
FastStone Image Viewer is a free piece of software I have been using for quite a few years now. It allows quick viewing of flat images, as well as resizing, changing color depth, adding simple text or simple filters. It also has a bulk image conversion tool, which we use here. The software currently operates only in single-thread mode, which should change in later versions of the software. For this test, we convert a series of 170 files, of various resolutions, dimensions and types (of a total size of 163MB), all to the .gif format of 640x480 dimensions.
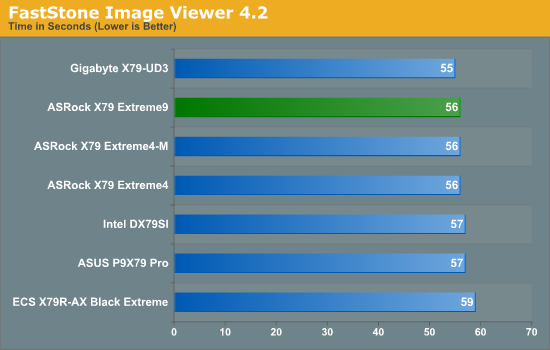
Singlethreaded performance is better, hitting 56 seconds in the FastStone test.
Sorenson Squeeze 6.0 - link
Sorenson Squeeze is a professional video encoder, complete with a vast array of options. For this test, we convert 32 HD videos, each a minute long and approximately 42 MB in size, to WMV 512KBps format. Squeeze can encode multiple videos at once, one for each thread.
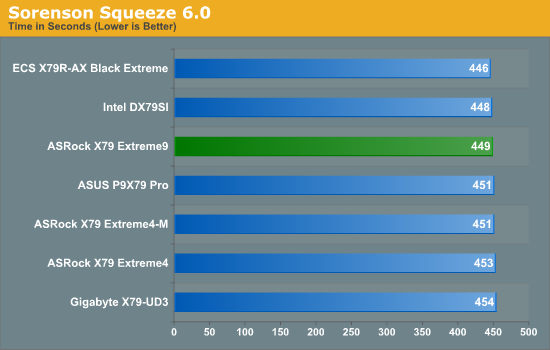
Our Squeeze test for video conversion shows little difference across any X79 board.


14 Comments
View All Comments
Hauk - Tuesday, January 24, 2012 - link
I remember jumping to X58 when I saw that a reasonably priced cpu (i7 920) which would OC like crazy came available. Not so much with X79, still waiting for i7 3820, all parts on hand, including an ASRock Extreme 7 ($259). It's not such a bad platform when cheap mobo's, cpus, and DDR3 are available. What about it Intel?? Stupid move IMO not getting 3820 to market sooner. X79 could have garnered more steam than it has..landerf - Tuesday, January 24, 2012 - link
For the record Creative's Core3D doesn't offload openal, in case anyone was expecting it too.BPB - Tuesday, January 24, 2012 - link
Does this board support SRT? If so I would actually consider spending the money on it.Blibbax - Tuesday, January 24, 2012 - link
"The X79 Extreme9 comes in around +50% more than those boards ($360 vs. ~$240), meaning I would expect 50% more when it came to the Extreme9."It never works like this. Is a Ferrari 5000% better than a Ford? What about 3960x vs. 3930k?
If you want maximum performance per price, there's no way you'd be looking at SB-E anyway.
purefun1965 - Wednesday, January 25, 2012 - link
I feel its overpriced. I would like it more if it was $300.00Stas - Wednesday, January 25, 2012 - link
ClrCMOS button is nice. That's about it.Stas - Wednesday, January 25, 2012 - link
Also, no 24-phase power? O.oAlexIsAlex - Wednesday, January 25, 2012 - link
I mentioned this in the last motherboard review, but as I didn't get an answer either way, I'll ask again just in case:What would be nice, in motherboard reviews, would be a measure of the cold boot (POST) time. This is something that different bioses can be differentiated on, and UFEI offers the potential for very fast boots if manufacturers take advantage of it properly.
Would it be possible to report, for comparison, the time between the power button being pressed and the installed bootloader starting? I was thinking it might be easiest to measure this by having no OS on the boot media and measuring the time to the "please insert boot media" message, but I'm sure you can think of other ways of doing it.
Another commenter also requested that this be done for both stock and overclocked settings, as he found boot times to be much slower with overclocked settings on his motherboard.
bji - Wednesday, January 25, 2012 - link
I would absolutely love to see these figures also. It is a major annoyance to me that my ASUS motherboard takes a full 7 - 8 seconds to even show the POST screen, and a further 1 - 2 seconds after that to get to my bootloader. I would personally highly value a greatly reduced POST time and would like to have this information in motherboard reviews. Having these values measured, evaluated, and compared is the only way that motherboard and BIOS makers will have any incentive to improve.javier_machuk - Sunday, January 29, 2012 - link
I'm on the same boat! my asus z68 board takes longer to post than to load windows with a intel 510 ssd!It would be interesting to compare this values between various manufacturers.