OCZ Z-Drive R4 CM88 (1.6TB PCIe SSD) Review
by Anand Lal Shimpi on September 27, 2011 2:02 PM EST- Posted in
- Storage
- SSDs
- OCZ
- Z-Drive R4
- PCIe SSD
Random Read/Write Speed
The four corners of SSD performance are as follows: random read, random write, sequential read and sequential write speed. Random accesses are generally small in size, while sequential accesses tend to be larger and thus we have the four Iometer tests we use in all of our reviews.
Our first test writes 4KB in a completely random pattern over an 8GB space of the drive to simulate the sort of random access that you'd see on an OS drive (even this is more stressful than a normal desktop user would see). I perform three concurrent IOs and run the test for 3 minutes. The results reported are in average MB/s over the entire time. We use both standard pseudo randomly generated data for each write as well as fully random data to show you both the maximum and minimum performance offered by SandForce based drives in these tests. The average performance of SF drives will likely be somewhere in between the two values for each drive you see in the graphs. For an understanding of why this matters, read our original SandForce article.
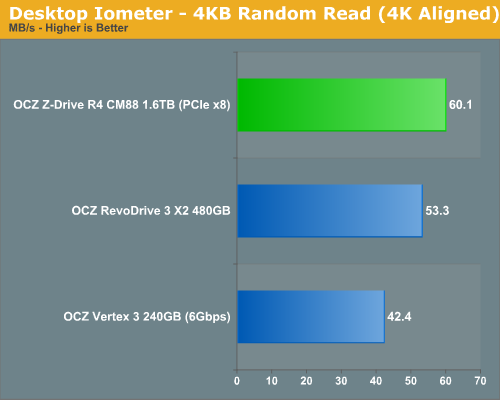
As we saw in our RevoDrive 3 X2 review, low queue depth random read performance doesn't really show much of an advantage on these multi-controller PCIe RAID SSDs. The Z-Drive R4 comes in a little faster than the RevoDrive 3 X2 but not by much at all. Even a single Vertex 3 does just fine here.
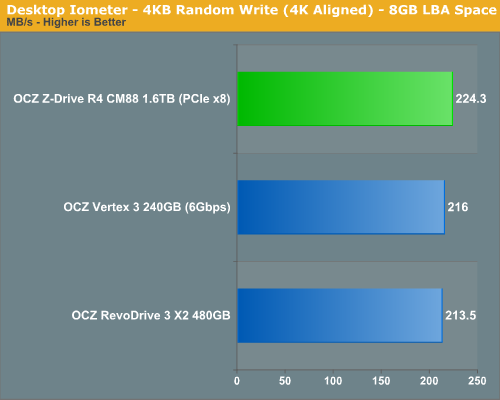
Random write performance tells a similar story, at such low queue depths most of the controllers aren't doing any work at all. Let's see what happens when we start ramping up queue depth however:
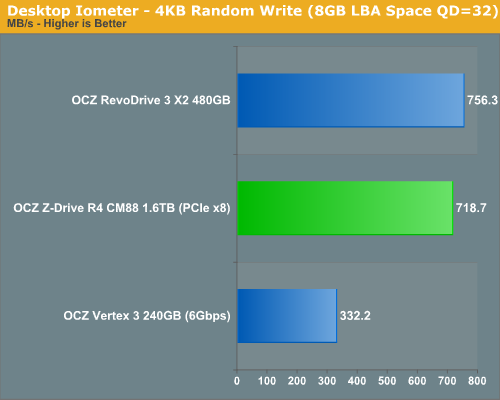
Surprisingly enough, even at a queue depth of 32 the Z-Drive R4 is no faster than the RevoDrive 3 X2. In fact, it's a bit slower (presumably due to the extra overhead of having to split the workload between 8 controllers vs just 4). In our RevoDrive review we ran a third random write test with two QD=32 threads in parallel, it's here that we can start to see a difference between these drives:
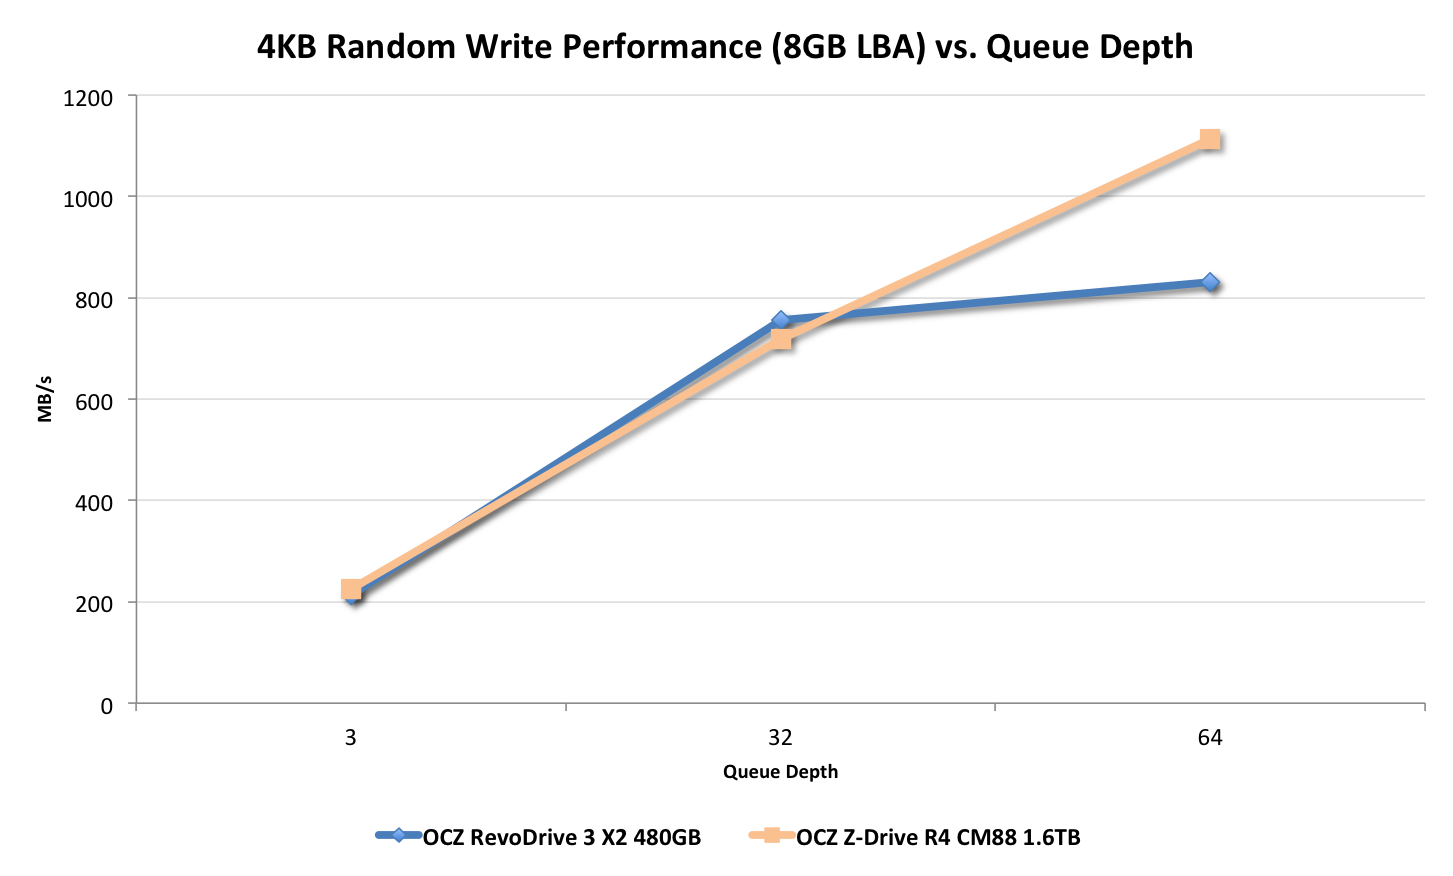
It's only at ultra high queue depths that the Z-Drive can begin to distance itself from the RevoDrive 3 X2. It looks like we may need some really stressful tests to tax this thing. The chart below represents the same data as above but in IOPS instead of MB/s:
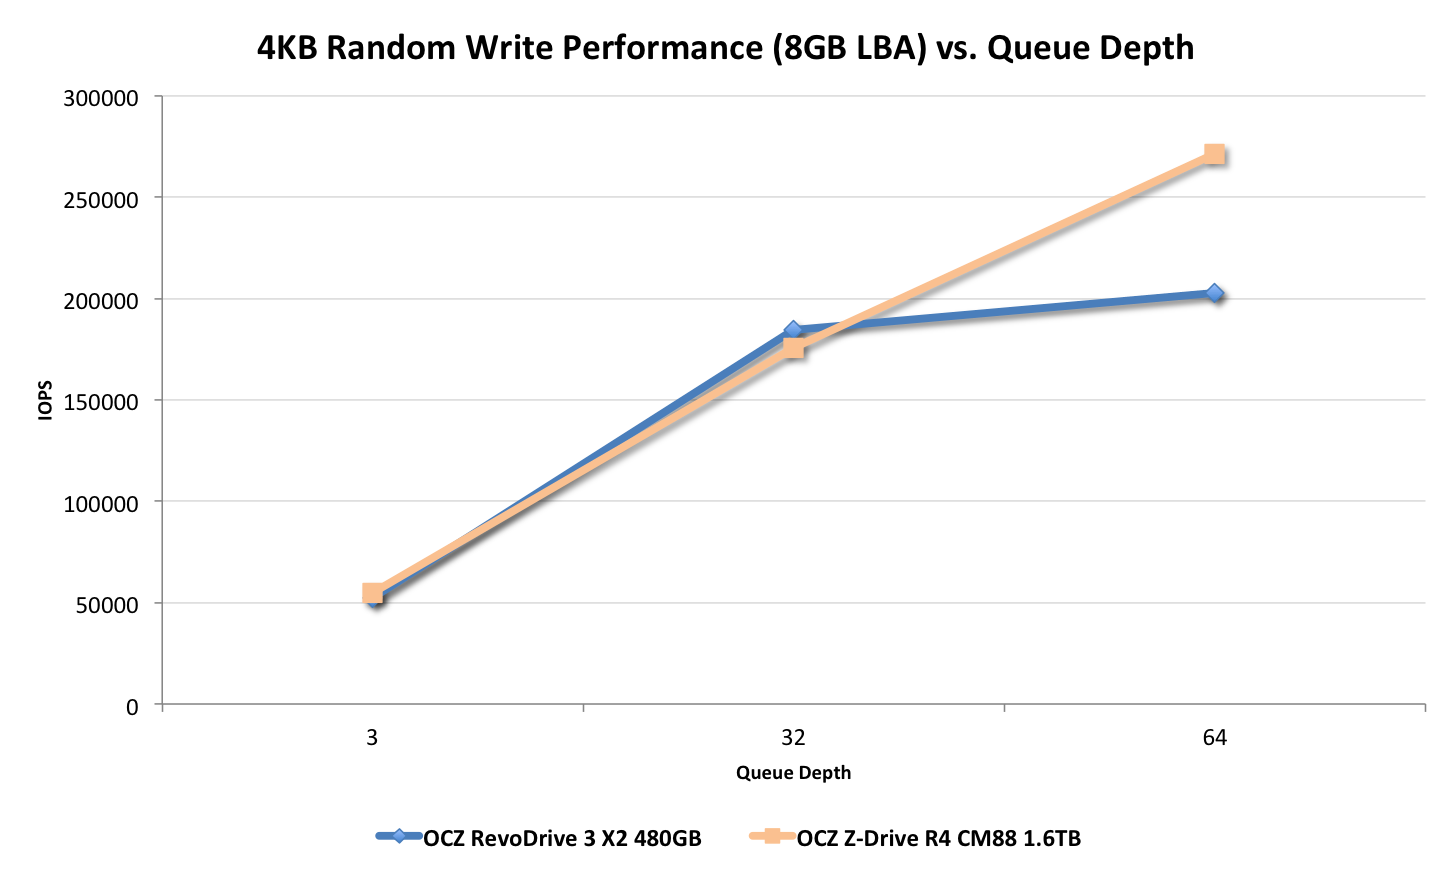
271K IOPS...not bad.


57 Comments
View All Comments
squashmeister99 - Tuesday, September 27, 2011 - link
You teased us with your video reviews. Now we cant go back... :-)G-Man - Tuesday, September 27, 2011 - link
I miss the video reviews already :-)vol7ron - Tuesday, September 27, 2011 - link
hahaha. they are a good addition aren't they?Rasterman - Wednesday, September 28, 2011 - link
Comparing a single Vertex 3 240GB to a 1.6TB doesn't seem quite valid. Someone considering the R4 would be asking what is the performance difference between the R4 and 4 to 16 Vertex 3s in RAID 0. Especially considering the massive cost savings per GB using the Vertex 3s.MrBungle123 - Wednesday, September 28, 2011 - link
I'd like to see some RAID 5/6/10 arrays of 15K RPM SCSI drives in the benchmarks too.marraco - Wednesday, September 28, 2011 - link
No. I don't want video reviews, unless they have English subtitles.SilthDraeth - Wednesday, September 28, 2011 - link
I have trouble hearing and use subs for all my movies, yet Anand speaks quite clearly, and I have no trouble understanding him.Also, he posts the video review in conjunction with the written review, and not as a stand alone feature, so you really don't need it subtitled. So you would still get to enjoy the reviews as you always have.
Lonbjerg - Thursday, September 29, 2011 - link
You can write english but not understand it when it's spoken? *shakes head*connor4312 - Thursday, September 29, 2011 - link
I'm guessing you never learned a second language?arthur449 - Wednesday, September 28, 2011 - link
Not all information provided is specifically relevant to everyone's interests in a review of a product. Similarly, information provided in a video review follows a linear arbitrary organizational structure that cannot possibly align with everyone's preferred method of learning. Also, it's easier to skim / search / quote / share a text-based review.