Kingston SSDNow V+100 Review
by Anand Lal Shimpi on November 11, 2010 3:05 AM EST- Posted in
- Storage
- SSDs
- Kingston
- SSDNow V+100
AnandTech Storage Bench
To avoid any potential optimizations for industry standard benchmarks and to provide another example of real world performance we've assembled our own storage benchmarks that we've creatively named the AnandTech Storage Bench.
The first in our benchmark suite is a light/typical usage case. The Windows 7 system is loaded with Firefox, Office 2007 and Adobe Reader among other applications. With Firefox we browse web pages like Facebook, AnandTech, Digg and other sites. Outlook is also running and we use it to check emails, create and send a message with a PDF attachment. Adobe Reader is used to view some PDFs. Excel 2007 is used to create a spreadsheet, graphs and save the document. The same goes for Word 2007. We open and step through a presentation in PowerPoint 2007 received as an email attachment before saving it to the desktop. Finally we watch a bit of a Firefly episode in Windows Media Player 11.
There’s some level of multitasking going on here but it’s not unreasonable by any means. Generally the application tasks proceed linearly, with the exception of things like web browsing which may happen in between one of the other tasks.
The recording is played back on all of our drives here today. Remember that we’re isolating disk performance, all we’re doing is playing back every single disk access that happened in that ~5 minute period of usage. The light workload is composed of 37,501 reads and 20,268 writes. Over 30% of the IOs are 4KB, 11% are 16KB, 22% are 32KB and approximately 13% are 64KB in size. Less than 30% of the operations are absolutely sequential in nature. Average queue depth is 6.09 IOs.
The performance results are reported in average I/O Operations per Second (IOPS):
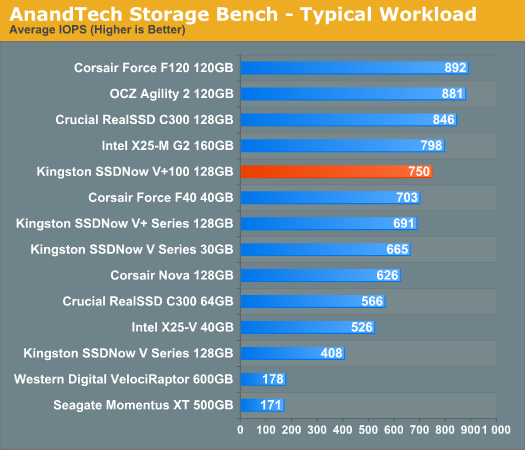
The higher capacity SandForce drives rule the roost here, but the C300, X25-M G2 and V+100 are not too far behind. Despite its age, Intel's X25-M G2 performs very well in our light usage test. The V+100 isn't far behind thanks to its 8.5% improvement over the original V+.
As far as small capacity drives go, the Corsair Force F40 and other similarly sized SandForce drives are the clear winners here. Crucial's 64GB RealSSD C300 is quicker than the X25-V, but no match for the 40GB SF drive.
If there’s a light usage case there’s bound to be a heavy one. In this test we have Microsoft Security Essentials running in the background with real time virus scanning enabled. We also perform a quick scan in the middle of the test. Firefox, Outlook, Excel, Word and Powerpoint are all used the same as they were in the light test. We add Photoshop CS4 to the mix, opening a bunch of 12MP images, editing them, then saving them as highly compressed JPGs for web publishing. Windows 7’s picture viewer is used to view a bunch of pictures on the hard drive. We use 7-zip to create and extract .7z archives. Downloading is also prominently featured in our heavy test; we download large files from the Internet during portions of the benchmark, as well as use uTorrent to grab a couple of torrents. Some of the applications in use are installed during the benchmark, Windows updates are also installed. Towards the end of the test we launch World of Warcraft, play for a few minutes, then delete the folder. This test also takes into account all of the disk accesses that happen while the OS is booting.
The benchmark is 22 minutes long and it consists of 128,895 read operations and 72,411 write operations. Roughly 44% of all IOs were sequential. Approximately 30% of all accesses were 4KB in size, 12% were 16KB in size, 14% were 32KB and 20% were 64KB. Average queue depth was 3.59.
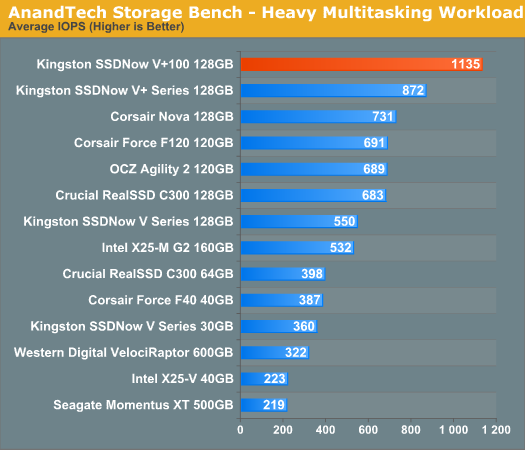
This is another one of those SYSMark-like situations. The old Toshiba controller did just awesome in our heavy multitasking workload and the new update does even better. At 1135 IOPS, the V+100 is 55% faster than the Indilinx based Corsair Nova. Thanks to the incompressible nature of much of the data we're moving around in this benchmark the SandForce drives don't do so well. Although not pictured here, the 256GB C300 would be #2 - still outperformed by the V+100.
The gaming workload is made up of 75,206 read operations and only 4,592 write operations. Only 20% of the accesses are 4KB in size, nearly 40% are 64KB and 20% are 32KB. A whopping 69% of the IOs are sequential, meaning this is predominantly a sequential read benchmark. The average queue depth is 7.76 IOs.
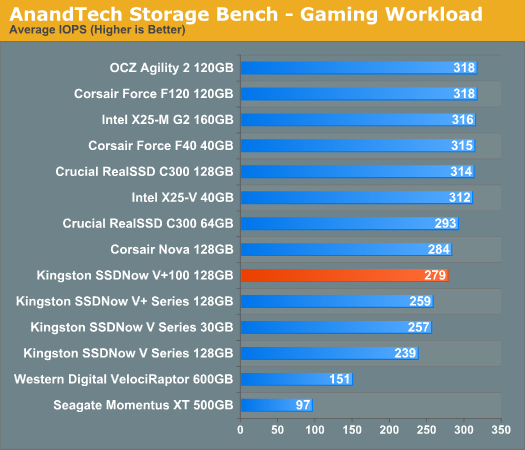
The perplexing nature of the V+100 continues here. While it boasts great sequential read numbers, the smaller and somewhat random accesses drop the V+100 behind the SandForce and Crucial SSDs.


96 Comments
View All Comments
Dorin Nicolaescu-Musteață - Thursday, November 11, 2010 - link
Anand, what about the Samsung 470 Series?It's been out since August and looks like a very nice drive. Why in the world the reviews have only started to appear this week on-line.
Nickel020 - Thursday, November 11, 2010 - link
Thanks for the review! I've got a few suggestionss/questions though.I've been out of the loop for a while and looking at Sandforce and other newer drives. So some Sandforce drives have the I/O limitations that were intended for the SF-1200 and some have SF-1500 like performance?
I'm surprised the Corsair F40 does so well. I thought the lower capacity drives performed worse than the 120GB versions, but it holds up really well. Or is this just a special case with the 40GB one and the 60GB is worse than the 40GB one? The 60GB Sandforce are also much better value than the 40GB ones, 50% more capacity at >20% more price. I find it strange you didn't include them and mentioned the 64GB C300 to be the value drive at their price point.
I'm pretty sure the Indilinx 60GB, the unlocked SF-1200 60GB and the X25-M 80GB are the most popular drives out there, which makes them great reference points, but they're not in the review. The former two are not on Bench either unfortunately. Do you have some around and could test them?
You tested the Crucial drives on the ICH10R, right?
Also, I would appreciate some blog posts or small articles about developments with newer FWs. I remember the FW development improving the Indilinx drives significantly, and am always wondering how accurate your older reviews still are given there are newer FWs out now. It would also be nice if you could list the tested FW version in Bench.
It would also be great if you could look at SSD performance in Macbooks. I want to put one in my Macbook Pro (Late 2008), but all the talk of freezing has me hesitating, and I haven't seen an in-depth look at this issue. Is it related to what kind of SSD you use, and does it make a difference wheter you have a late 2008 or mid 2009? It would also be interesting to see how tha lack of TRIM actually affects different drives under OSX.
That's all for now, thanks again!
retnuh - Thursday, November 11, 2010 - link
I've had a OWC Mercury Extreme Pro 240GB in my late 2008 MBP since may, not one issue or freezing. Best upgrade you can do.http://eshop.macsales.com/shop/internal_storage/Me...
iwod - Thursday, November 11, 2010 - link
I posted and asked on many forums and did not found an answer to my MBA ( Macbook Air ) question.Why did the MBA do so well in its test, while its performance data were below the King of SSD controller, Sandforce?
No one could answer. There were number of review pointing out that their MBA actually feels snappier then their Macbook with Sandforce or Intel SSD. Although this is impossible when first heard, numerous other review site seems to confirm similar findings. Of cause there is no way to test it out since the MBA does not have an regular SATA slot.
Now this article actually print out the truth. The same Toshiba SSD controller used in MBA's SSD, is top of the chart in BOTH Synthetic Benchmarks and Real World usage ( Anand Bench ) Benchmarks. What we have been talking as the Holy Grail of SSD Performance Delta, the 4K Random Read / Write, didn't matter when Toshiba was literally the bottom of the chart in those test.
There is a reason why Apple choose a Inferior part ( To us at the time ) instead of Sandforce. The argument for choosing it because of always On GC doesn't make sense, since Sandforce has the same capabilities within the Firmware itself.
One reason would be Toshiba is a NAND manufacture itself, and buying NAND and Controller directly from Toshiba would be cheaper. The other reason being Toshiba ( properly involve Sandisk as well since their JV ) had a controller chip which is very fast.
There has to be an missing pieces in our performance test, something that these companies knows and we dont.
Chloiber - Thursday, November 11, 2010 - link
I'd like to see more real world tests - and I don't consider the AnandTech Storage Bench to be "real world" - it's still a bench, like PCMark.But yes, you are right: synthetic tests tell us little about the performance you actually get from an SSD. There are more unknown variables than we think.
You may see big differences in benches like SysMark or PCMark - and even bigger differences in synthetic tests like AS SSD or even IOMeter. But these scores tell us little about REAL world performance - and with REAL I mean things like:
- "How long does it take to start Photoshop while running Virus Scan?"
- "How long does it take to start iTunes while unzipping a not-so-much-compressed zip-file?"
That's the things I care about. And interestingly, you often get COMPLETELY different results, than what you would think when looking at synthetic tests or "half-synthetic"-tests like PCMark or AnandTech Storage Bench.
Anand Lal Shimpi - Thursday, November 11, 2010 - link
I used to run a lot of those types of tests, however I quickly found that if you choose your iometer and other benchmarks appropriately they don't any new data. And often times they are so limited in their scope (e.g. launch an application with virus scan in the background) that you don't see any appreciable differences between drives. Most high end SSDs are fast enough to do most of these types of tasks just as quickly as one another. It's when you string a bunch of operations together and look for cumulative differences in response time or performance that you can really begin to see which one is faster. These types of scenarios are virtually impossible to perform with consistency by hand, that's where our test suite comes in.AnandTech Storage Bench, PCMark and even SYSMark do what is necessary - they measure performance of a more complex usage case. PCMark Vantage is a great showcase of truly light workload I/O performance, while SYSMark is more CPU bound and shows you how small the differences can be. Our own benchmark offers a more modern set of usage models (we actually do run photoshop while virus scan is active and actually edit images in photoshop, all while doing other things as well).
All of these tests are application based, they are simply scripted or isolate the I/O component specifically. They give us a look into bursts of activity that's, again, near impossible to reproduce by hand with a stopwatch.
Benchmarking a specific task usually just repeats some information we've already presented, fails to present the bigger picture or shows no repeatable difference between drives. I can absolutely add those types of benchmarks back in, however I originally pulled them out because I believed they didn't add anything appreciable to the reviews.
Of course this is your site, if you guys would like me to present some of that data I definitely can :)
Take care,
Anand
Nickel020 - Thursday, November 11, 2010 - link
The problem is that the synthetic tests you do are hard to interpret for just about anyone. "What drive is the best for this usage profile?" is still really hard to answer after reading your reviews (not that anyone else does a better job).And even if there is little difference between todays drives in the level loading time tests you used to do, we don't know that even if you do. Right now the average AT reader reads this test and doesn't know that the more expensive drives won't load his games noticeably faster or perform better when doing video editing.
Maybe you should give recommendations for certain usage profiles, like video editing, photo editing, gaming etc. Even if you're just saying that there's not gonna be a noticeable difference.
wumpus - Thursday, November 11, 2010 - link
It might help if you included statements like "you don't see any appreciable differences between drives. Most high end SSDs are fast enough to do most of these types of tasks just as quickly as one another." a bit more often in the articles. While we might be interested in the technical data, it would usually be foolish to buy SSDs by things other than size, price, and reliability.Chloiber - Saturday, November 13, 2010 - link
But that's the thing. You don't see any difference in an application a "normal" homeuser would use. We see huge differences in those synthetic tests, but in reality, you don't have any faster loading time.Of course you can test it like this and say:
"You don't see much difference between these three SSDs in "real world" application tests. Get the cheapest SSD (or most robust, whatever)."
Or another position (I think the one you are currently in) is:
"You don't see much difference between these three SSDs in "real world" application tests so let's stress them some more and base our verdict on those stresstests."
The thing is:
a) You don't know how the SSDs would REALLY react if you stress them in reality like this. They are still synthetic tests and unless you can prove that there are scenarios where differences appear (without any influence of some kind of bench program) they don't tell us that much.
b) I think we have to begin to widen our horizon a little bit. Why exactly is it, that you don't see any beneftit using a, let's say, 50k IOPS drive and a 15k IOPS drive? Shouldn't you see some significant faster load times?
Im telling you this because of future SSDs. We get 30k IOPS, soon 60k IOPS, and in one year maybe over 100k IOPS. The score in your benches gets bigger and bigger...and bigger...
And what exactly is it the user gets? NOTHING because everything else in his computer is limiting his SSD (which is already happening right now!)!
I agree that you have to test hardware in scenarios, where nothing else is limiting your subject. That's why you use a 4GHz i7 when testing GPUs. That's why you test CPUs game performance using a very low resolution.
But I think it's really important that you also test scenarios a user experiences in reality. And that means in this case: "real world" benches. And yes, there will be nearly no difference there. But isn't this the thing I want to know? If I spend 600$ on a fking RevoDrive and nothing loads faster, I WANNA KNOW ABOUT IT!
I hope you see my point :)
Out of Box Experience - Thursday, November 11, 2010 - link
Real World testing of SSD's should be done in a worst case scenaio on the lowest common denominatorThey should be plug and play on XP machines without any tweaks on the slowest computer you use to amplify the differences between drives
I use a copy/paste test on ATOM CPU's to guage the Real World differences between Platter drives and SSD's
Using 200MB of data (900+ files in 80 or so folders), I simply time a copy/paste of that data on the ATOM computer
Using a faster computer WILL reduce the "Relative" speed gap between drives to the point where it becomes hard to tell which of two drives is actually the fastest
Using Windows 7 with its funky caching scheme will make ALL the drives appear to copy and paste at the same speed on the ATOM core and therefore cannot be used for this test
A 40GB Vertex 2 can copy and paste this data in 55 seconds (3.6MB/sec)
A 5400RPM Western Digital Laptop drive does it in 54 seconds
A 7200RPM Western Digital Desktop Drive takes 17 seconds
ALL testing was done under XP-SP2 without ANY tweaks!
All tests were repeated for accuracy
Sandforce SSD's are HORRIBLE at handling data that is NOT compressible or that is already on the drive in compressed form
Any drive that requires Windows 7 or multiple tweaks just to give you "Synthetic" numbers that have no bearing in the Real World are worthless
Show us how they compare in a worst case scenario on the least common denominator for results we can use please
I'm tired of hearing how great Sandforce drives are when they can't even beat a 5400RPM laptop drive in a Real World test such as the one I've just described