VMmark Scores Investigated: should VMmark be part of your hardware decisions?
by Johan De Gelas on May 8, 2009 12:00 AM EST- Posted in
- IT Computing
Understanding the VMmark Score
Before we try to demystify the published VMmark scores, let me state upfront that the VMmark benchmark has it flaws, but we know from firsthand experience how hard it is to build a decent virtualization benchmark. It would be unfair and arrogant to call VMmark a bad benchmark. The benchmark first arrived back in 2006. The people of VMware were pioneers and solved quite a few problems, such as running many applications simultaneously and getting one score out of the many different benchmarks, all with scores in different units. The benchmark results are consistent and the mix of applications reflects more or less the real world.
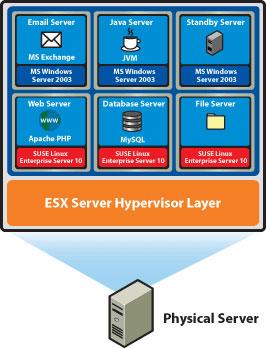
Let's refresh your memory: VMware VMmark is a benchmark of consolidation. It consolidates several virtual machines performing different tasks, creating a tile. A VMmark tile consists of:
- MS Exchange VM
- Java App VM
- Idle VM
- Apache web server VM
- MySQL database VM
- SAMBA fileserver VM
The first three run on a Windows 2003 guest OS and the last three run on SUSE SLES 10.
Now let's list the few flaws:
- The six applications plus virtual machines in one tile only need 5GB of RAM. Most e-mail servers running right now will probably use 4GB or more on their own! The vast majority of MySQL database servers and java web servers have at least 2GB at their disposal.
- It uses SPECjbb, which is an "easy to inflate" benchmark. The benchmark scores of SPECjbb are obtained with extremely aggressively tuned JVMs, the kind of tuning you won't find on a typical virtualized, consolidated java web server.
- SysBench only works on one table and is thus an oversimplified OLTP test: it only performs transactions on one table.
Regarding our SysBench remark, as OLTP benchmarks are very hard, we also use SysBench and we are very grateful for the efforts of Alexey Kopytov. SysBench is in many cases close enough for native situations. The problem is that some effects that a real world OLTP database has on a hypervisor (such as network connections and complex buffering that requires a lot more memory management) may not show up if you run a benchmark on such an oversimplified model.
The VMmark benchmark is also starting to show its age with its very low memory requirements per server. To limit the amount of development time, the creators of VMmark also went with some industry standard benchmarks, which have been starting to lose their relevance as vendors have found ways to artificially inflate the scores. VMmark needs an update, but as VMware is involved in the SPEC Virtualization Committee to develop a new industry standard virtualization benchmark, it does not make sense to further develop VMmark.
The easiest way to see that VMmark is showing its age is in the consolidation ratio of the VMmark runs. Dual CPU machines are consolidating 8 to 17 tiles. That means a dual CPU system is running 102 virtual machines, of which 85 are actively stressed! How many dual CPU machines have you seen that even operate half that many virtual machines?
That said, we'll have to work with VMmark until something better comes up. That brings up two questions. How can you spot reliable and unreliable VMmark scores? Can you base decisions on the scores?


23 Comments
View All Comments
ktwebb - Saturday, May 16, 2009 - link
"How many of us are running more than 50 to 100 VMs, which need on average only 1GB per VM?"600+ VM's. Less than 10% run with more than a gig of memory. 90% of the VM's runnning windows 2003
JohanAnandtech - Saturday, May 16, 2009 - link
On one physical server? that would probably be a new record :-).joekraska - Thursday, May 14, 2009 - link
I run a virtual data center with over 800 virtual machines in it and a sustained 25+% growth rate. I found it curious that one poster wrote that "no one pays attention to this." We do pay attention to it, it's the first (and only) benchmark that I look at in deciding things on our side, however not for the reason that might first appear. To wit, we do not use it to decide between vendors: we already have the 'best' vendor, and in truth given two different vendor systems based on the same underlying intel equipment, the results are insufficiently different to compel a vendor-switch, generally speaking. Besides that, we're homogenous. No, that's not why we're interested at all.However, we /are/ interested in using VMMark data to help us decide which of our current vendors many platforms we will switch to, when we switch, as well as slightly influencing WHEN our recap occurs. You have to keep in mind that VMWare licenses are quite costly. And the maintenance is costly! There is a cold calculus to ongoing consolidation involving server costs, memory footprint (e.g., can the new server hold many more dimms than the last), and the price one pays for vmware. VMMark data and the ratio of memory per CPU in a proposed new server type both play a key deciding role here.
C//
duploxxx - Sunday, May 10, 2009 - link
I'll give some ideas on reality and this is based several months perf testing and many installations.lets say we use 4 types of VM's: dbs + file server + compression server + iis server.
If I run these Vm's in a 2cpu 4GB config at 60-70% of load.
All these combined on a 2s quad machine we run 3VM if we would use 4vm we see a perf drop of approx 10% in total netw and i/o.
that is reality, quite a difference then these benchmarking scores. but the vmmark still gives a good idea about cpu performance. For example compare barcelona against harpert and the harpert will require about 10-15% more clock for equal perf, against shanghai this raised even to 20-25% as you would clearly see in vmmark. The 3,3harper was not able to perform like a 2,7 shangh.
Now with nehalem the stakes are changed, I didn't check a full build yet but from what i've seen it will be 10-15% more shanghai speed required against nehal. HT ain't doing nothing here when you have some heavy Vm's, when you run 15-20/1 server farm you might have some added value here.
The solution for AMD will be Istanbul, although not much faster clock/clock then shangh it will add more real cores, with current cache system and ht link the istanbul will scale good enough. For high load VM this will be a much better choice then a HT core. As long as VM off course stays in the same price/socket system :)
That will be for sure my choice of building rig.
has407 - Saturday, May 9, 2009 - link
"The easiest way to see that VMmark is showing its age is in the consolidation ratio of the VMmark runs. Dual CPU machines are consolidating 8 to 17 tiles. That means a dual CPU system is running 102 virtual machines, of which 85 are actively stressed! How many dual CPU machines have you seen that even operate half that many virtual machines?"True. OTOH, the more VM's, the greater the stress on the hypervisor, which is essentially a measure of how well the hypervisor multi-tasks (or more accurately "multi-VM's"). While obviously not indicative of real-world workloads, as a synthetic measure it would seem a reasonable first-order indication of the hypervisor's efficiency dealing with disparate VM's.
That said, I'd agree that there is no substitute for measuring and analyzing real-world workloads. Anyone who depends on a VMark score for determining their virtualization strategy or how many VM's they can shove into a box is in for a rude surprise. Not to mention that VMware has quite a few papers on specific apps that provide good clues and a good basis for analysis independent of VMark.
Then again, I don't know of anyone with more than a room temperature IQ that depends on VMark or uses it for anything but bragging rights. The typical and appropriate steps are to (1) look at the current workload; (2) do an estimate of what that will look like when virtualized; (2) try it with a subset of the worload; (3) correct estimates and calculations as needed; (4) move forward.
In short, VMark may be flawed, but the flaw has less to do with VMark and more with the way people use it. VMark scores provide one potentially useful data point--but only one data point.
JohanAnandtech - Saturday, May 9, 2009 - link
"the greater the stress on the hypervisor, which is essentially a measure of how well the hypervisor multi-tasks (or more accurately "multi-VM's").Excellent comment... VMmark is indeed overemphasizing relatively simple world switches.
"While obviously not indicative of real-world workloads, as a synthetic measure it would seem a reasonable first-order indication of the hypervisor's efficiency dealing with disparate VM's."
Indeed. But IMHO, VMmark spends too much time in the scheduler, which makes the percentage it's spends in the exception handling (Hardware virtualization works with exceptions: Memory management, Interrupts etc.) uncharacteristically low. Further analysis needed of course.
has407 - Saturday, May 9, 2009 - link
Just as with any OS, the effectiveness of the scheduler is a function of how fairly and efficiently it manages the available resources. For a CPU-intensive workload it's generally pretty simple. It's when you start throwing in IO (or QoS) that really tests the mettle of a scheduler.The reason why those VMark reports tend to show such a ludicrously high number of tiles is because that is typically the number of tiles needed to saturate the CPU. Which is another way of saying that either: (1) the workload is too heavily IO-bound; or (2) the IO subsystem is too slow relative to the workload.
Which is the reason the VMark tests typically ramp up the number of tiles until CPU saturation, otherwise you're testing--and constrained by--the IO subsystem's performance, (which is typically the limiting factor), and not the hypervisor's performance. Obviously the hypervisor's IO efficiency is a factor, but if you've still got 20% CPU idle, you can push it further.
That's not to say VMark is "correct"; at the risk of oversimplification...
1. Would a smaller number of tiles/VM's produce less time in the hypervisor? Yes, as there are fewer VM's with timers, etc. to be emulated. That could be measured by running an increasing number of idle VM's and measuring the hypervisor cost. E.g., if basic emulation takes 1% of the CPU per idle VM, then 50 VMs should consume 50% of the CPU.
2. Would a smaller number of VM's incur less scheduling overhead? Maybe. It largely depends on what the VM's are doing:
a) For a CPU-bound workload, the difference is probably nominal for any but an extreme number of VM's. That could be easily determined by running an increasing number of CPU-intensive VM's and calculating the additional pure scheduling overhead/VM. E.g., if the scheduling and context switch overhead is 1ms/VM, and the scheduling quantum is 100ms, then pure scheduling and context-switch overhead will consume 50% with 50 VM's
b) For an IO-bound workload, there will be more events likely to invoke the scheduler, and thus increasing scheduler time. Is that increased scheduler time a function of the number of VM's or the number of IO events? Hard to say, but I'd argue the latter. For the VM doing the IO, that's also more likely to lead to that VM stalled waiting on IO (unless of course that VM also has CPU-bound processes), so the more VM's the more likely the hypervisor can find a non-stalled VM and keep the CPU utlized doing useful work.
3. Would a smaller number of VM's that produced an aggregate IO load (IO events and thus scheduling events) equivalent to a bunch of VMark tiles show an appreciable difference? Maybe... too many factors to make blanket statements, such as the type of IO, the speed of the hardware IO subsystem, and the hypervisor's efficiency in performing specific types of IO. Which of course is why people really should measure their workloads. (VMWare also has a number of micro-benchmarks available that provide clues independent of VMWark.)
In short, I think that if VMark has a problem, it's less a matter of how many VM's, and more that the aggregate IO load from all those (small) VM's is higher than what a real-world set of (larger) VM's will produce given the the number of VM's that can fit into the same amount of memory. That would mean lower CPU utilization (more likely all VM's are waiting on IO), or it means your IO subsystem is too slow (and EMC is ready and waiting to help you fix that :).
tviceman - Friday, May 8, 2009 - link
Synthetic benchmarks are a worthless waste of time and reading. When I purchase a new CPU, GPU, RAM, HD, etc. for improved performance it is based only on real world applications.has407 - Friday, May 8, 2009 - link
"One of the reasons that these configurations obtain higher scores is the fact they run with two DIMMs per channel, so the DDR3 DIMMs run at 1066MHz. That is good for a boost of 5-6%, which has been confirmed by both Intel's and AMD's VMmark experts. The second and most important reason..."You forgot about EPT support that showed up with Nehalem, which can provide nominal to very significant performance improvements.
JohanAnandtech - Saturday, May 9, 2009 - link
I mention it elsewhere in the article, but I agree that I should have talked about EPT in that sentence too :-).EPT is probably good for about 20%. I would try it out myself, but VMmark requires at least 72 GB on a Nehalem Xeon, and that is out of the reach of our lab right now.