Zippy Gaming G1 (GSM-6600P): Hybrid or Fence-Sitter?
by Christoph Katzer on August 3, 2007 2:30 AM EST- Posted in
- Cases/Cooling/PSUs
Testing
As usual we are testing with our Chroma programmable loads equipment to fully load each rail to a specific amount. This is important to get truly accurate results and not merely approximate values. The tests are conducted in two different temperature environments. One is normal room temperature of 25-26°C, while the second environment goes from room temperature and increases steadily up to 50°C. Especially during the higher temperatures we will see how good the power supplies are and what they're really made of. Components inside will perform much worse at higher temperatures, but we expect any good quality PSU to deal with such test conditions without failing.
Note: If you would like to know more about our testing methodology, equipment, and environment, please read our Power Supply testing overview.
3.3V DC Output
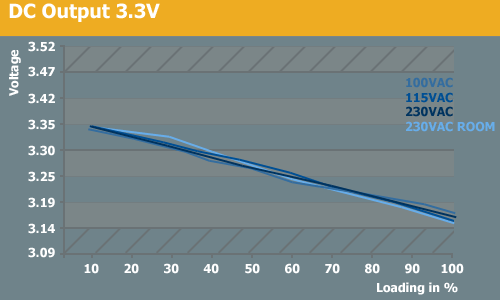
The 3.3V rail is the worst performing rail on the G1 power supply. It has a steadily decreasing voltage drop but does stay within specifications fortunately. Before sending us the samples the marketing people at Zippy expressed a little concern about the high temperature test environment, since their PSUs are rated at only 40°C. (We have to add here that most companies are rating their power supplies at just 25°C, so Zippy shouldn't have been concerned at all.) Temperatures didn't actually affect the results much, however, as even at room temperature we see similar performance from the various rails.
5V DC Output
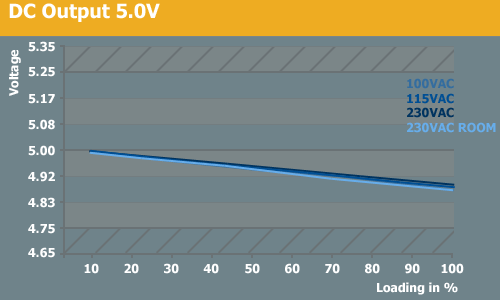
The 5V rail looks better and maintains a relatively steady output. With a range of 5.00V to 4.88V the 5V rail can be described as very stable. We might like to see the voltages shifted up 0.05V, but it's not really necessary.
12V DC Output
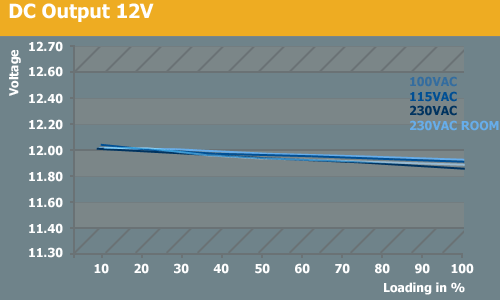
We weren't surprised to see the most stable 12V rails of any PSU we've tested so far - a clear indication of Zippy's server PSU roots. It doesn't matter what temperature, input voltage, or load use with this power supply; it gets to work and always delivers an extremely stable 12V output. The lowest output we measured was just 11.83V at 50°C and maximum load. We have not seen better results so far.
5Vsb DC Output
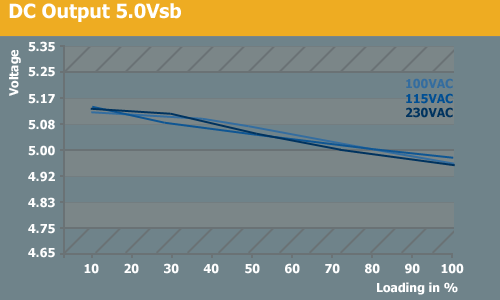
The 5Vsb rail has good results over the range of loads. It starts out somewhat high (which is usually considered better than being low) and at the highest load we had just a few millivolts less than the ideal.
As usual we are testing with our Chroma programmable loads equipment to fully load each rail to a specific amount. This is important to get truly accurate results and not merely approximate values. The tests are conducted in two different temperature environments. One is normal room temperature of 25-26°C, while the second environment goes from room temperature and increases steadily up to 50°C. Especially during the higher temperatures we will see how good the power supplies are and what they're really made of. Components inside will perform much worse at higher temperatures, but we expect any good quality PSU to deal with such test conditions without failing.
Note: If you would like to know more about our testing methodology, equipment, and environment, please read our Power Supply testing overview.
3.3V DC Output
| 3.3V Rail | |||
| Percentage | Ampere | Wattage | Wattage (All Rails) |
| 10% | 1.86 | 6.23 | 60.19 |
| 20% | 3.72 | 12.43 | 120.16 |
| 30% | 5.59 | 18.62 | 179.95 |
| 40% | 7.45 | 24.66 | 239.54 |
| 50% | 9.31 | 30.72 | 298.95 |
| 60% | 11.17 | 36.75 | 358.06 |
| 70% | 13.03 | 42.74 | 417.19 |
| 80% | 14.9 | 48.57 | 475.44 |
| 90% | 16.76 | 54.47 | 533.52 |
| 100% | 18.62 | 60.33 | 591.82 |
The 3.3V rail is the worst performing rail on the G1 power supply. It has a steadily decreasing voltage drop but does stay within specifications fortunately. Before sending us the samples the marketing people at Zippy expressed a little concern about the high temperature test environment, since their PSUs are rated at only 40°C. (We have to add here that most companies are rating their power supplies at just 25°C, so Zippy shouldn't have been concerned at all.) Temperatures didn't actually affect the results much, however, as even at room temperature we see similar performance from the various rails.
5V DC Output
| 5V Rail | |||
| Percentage | Ampere | Wattage | Wattage (All Rails) |
| 10% | 1.86 | 9.3 | 60.19 |
| 20% | 3.72 | 18.56 | 120.16 |
| 30% | 5.59 | 27.78 | 179.95 |
| 40% | 7.45 | 36.95 | 239.54 |
| 50% | 9.31 | 45.99 | 298.95 |
| 60% | 11.17 | 55.07 | 358.06 |
| 70% | 13.03 | 64.11 | 417.19 |
| 80% | 14.9 | 72.86 | 475.44 |
| 90% | 16.76 | 81.79 | 533.52 |
| 100% | 18.62 | 90.49 | 591.82 |
The 5V rail looks better and maintains a relatively steady output. With a range of 5.00V to 4.88V the 5V rail can be described as very stable. We might like to see the voltages shifted up 0.05V, but it's not really necessary.
12V DC Output
| 12V Rail | |||
| Percentage | Ampere | Wattage | Wattage (All Rails) |
| 10% | 3.64 | 43.75 | 60.19 |
| 20% | 7.27 | 87.24 | 120.16 |
| 30% | 10.91 | 130.81 | 179.95 |
| 40% | 14.55 | 174.31 | 239.54 |
| 50% | 18.18 | 217.62 | 298.95 |
| 60% | 21.82 | 260.75 | 358.06 |
| 70% | 25.45 | 303.87 | 417.19 |
| 80% | 29.09 | 346.75 | 475.44 |
| 90% | 32.73 | 389.16 | 533.52 |
| 100% | 36.36 | 431.96 | 591.82 |
We weren't surprised to see the most stable 12V rails of any PSU we've tested so far - a clear indication of Zippy's server PSU roots. It doesn't matter what temperature, input voltage, or load use with this power supply; it gets to work and always delivers an extremely stable 12V output. The lowest output we measured was just 11.83V at 50°C and maximum load. We have not seen better results so far.
5Vsb DC Output
| 5Vsb Rail | |||
| Percentage | Ampere | Wattage | Wattage (All Rails) |
| 10% | 0.18 | 0.92 | 60.19 |
| 20% | 0.36 | 1.84 | 120.16 |
| 30% | 0.55 | 2.81 | 179.95 |
| 40% | 0.73 | 3.71 | 239.54 |
| 50% | 0.91 | 4.61 | 298.95 |
| 60% | 1.09 | 5.49 | 358.06 |
| 70% | 1.27 | 6.38 | 417.19 |
| 80% | 1.45 | 7.25 | 475.44 |
| 90% | 1.64 | 8.17 | 533.52 |
| 100% | 1.82 | 9.01 | 591.82 |
The 5Vsb rail has good results over the range of loads. It starts out somewhat high (which is usually considered better than being low) and at the highest load we had just a few millivolts less than the ideal.


16 Comments
View All Comments
crimson117 - Monday, August 6, 2007 - link
The last two paragraphs in the Conclusion are in italics.http://www.anandtech.com/casecoolingpsus/showdoc.a...">http://www.anandtech.com/casecoolingpsus/showdoc.a...
JarredWalton - Monday, August 6, 2007 - link
Sorry - fixed now. Missed the closing > of the "turn off italics" tag. That's what I get for inserting a quick comment after posting. :|irev210 - Saturday, August 4, 2007 - link
From a build-quality standpoint... it is hard to find another PSU that can touch these.I hope that anandtech looks at more zippy units.
lopri - Saturday, August 4, 2007 - link
I, like many others, am loving the new PSU review series from AT. The articles so far are superb and full of good information, and best of all is that the information is largely based on the end-users' point of view. I'd like to thank AT for these reviews. Keep up the good work!Duraz0rz - Friday, August 3, 2007 - link
Are there no separate graphs for different ambient temperatures anymore? On page 5, you say you test for two different temperatures: 25C and 50C, but I only see one graph per rail and I have no clue which temperature that is for. You do mention in one of your paragraphs about Zippy being worried about testing @ 50C, so I'm confused.Nice review, nevertheless, but like you said, it is a little expensive.
JarredWalton - Friday, August 3, 2007 - link
The second graph (with higher temperatures) starts at 25C and ramps up to 50C by 100% load - just like in previous PSU reviews. Note the subtitle on the first temp graph - "Tested at Room Temperature".Duraz0rz - Friday, August 3, 2007 - link
That's the thing...there's only one graph per rail on page 5.JarredWalton - Friday, August 3, 2007 - link
The 230VAC-Room is done at room temperature (25-26C). It's present on all the charts except for the 5vsb (where it really doesn't matter much). We combined all four results into one chart because that seemed to be more useful for comparing the results and condensing the article into 8 pages instead of 22. :)Super Nade - Friday, August 3, 2007 - link
You won't recommend it for overclocking or a rig with a quad-core CPU? Why? Very strange conclusion after stating that it regulates like no other. Would a real enthusiast care about noise or the 5VSB and standby efficiency when breaking records or pushing the envelope of his machine?"In most other areas, it unfortunately falls short."
Apart from the electrical characteristics does the "failure" in "other" areas really matter?
JarredWalton - Friday, August 3, 2007 - link
This statement has been edited for clarity. Overclocking on it's own isn't a problem, and neither are quad cores or (certain) dual GPU configurations - don't try dual HD 2900 XT, most likely, since besides two PEG connections per card they can also use an 8-pin PEG as one of the connections. You can basically do two of the items in that list, but if you try to do all three you're going to go WAY over 600W.8800 GTX SLI (using factory OC'ed models) and Q6600/6700 @ ~3.47 GHz with two or three hard drives and idle power use will be in the neighborhood of 400-450W. Load up the CPU (say, Folding@Home SMP) and you can easily hit 600W or more. Play some games that load up the GPUs, and you really ought to be running a 1000W PSU - assuming maximum efficiency as usual comes in the 50-80% load range.
It falls short in noise, cooling performance, connections for certain devices. As an enthusiast, I definitely don't want a PSU that cranks out that much noise, considering there are other PSUs (SeaSonic) that will match the Zippy in all other ways and do it at lower noise levels.