Seagate Barracuda 7200.10 750GB: Size Does Matter
by Gary Key on May 18, 2006 9:00 AM EST- Posted in
- Storage
PCMark05
We are utilizing the HDD test suite within PCMark05 for further comparative hard disk scores as it provides a mixture of actual application results and specific read/write percentages utilized within these programs. The program utilizes the RankDisk application within the Intel IPEAK SPT suite of tools to record a trace of disk activity during usage of real world applications. These traces are then replayed to generate performance measurements based upon the actual disk operations within each application. The HDD test suite contains 53% read and 47% write operations with each trace section utilizing varied amounts of read or write operations. Additional information about the test suite can be found in PDF format in the PCMark05 whitepaper.Our test results are based upon the following trace runs:
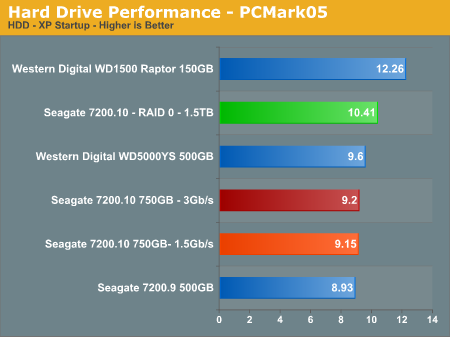
Windows XP Startup: This test consists of 90% reading and 10% writes that tracks XP activities at startup.
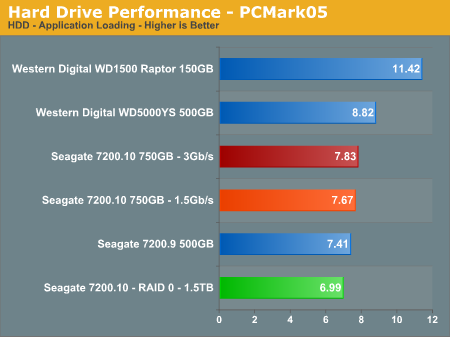
Application Loading: This test consists of 83% reading and 17% writes that tracks the opening and closing of the following programs.
Microsoft Word
Adobe Acrobat Reader
Windows Media Player
3Dmark 2001SE
Leadtek Winfast DVD
Mozilla Internet Browser.
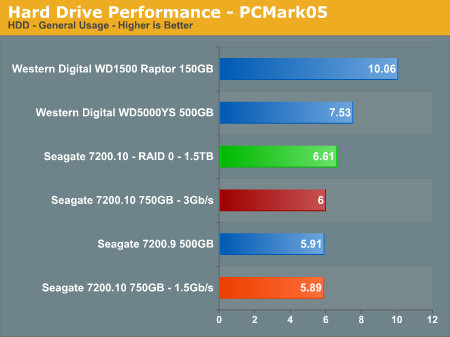
General Hard Disk Drive Usage: This test consists of 60% reading and 40% writes that tracks application usage utilizing the following settings.
Opening a Microsoft Word document, performing grammar check, saving and closing.
Compression and decompression using WinZip
Encrypting and decrypting a file using PowerCrypt
Scanning files for viruses using F-Secure Antivirus
Playing an MP3 file with Winamp
Playing a WAV file with Winamp
Playing a DivX video using DivX codec and Windows Media Player
Playing a WMV video file using Windows Media Player
Viewing pictures using Windows Picture Viewer
Browsing the Internet using Microsoft Internet Explorer
Loading, playing and exiting a game with Tom Clancy's Ghost Recon
Virus Scanning: This test consists of 99.5% read operations as the test tracks the scanning activities of 600MB of files for viruses.
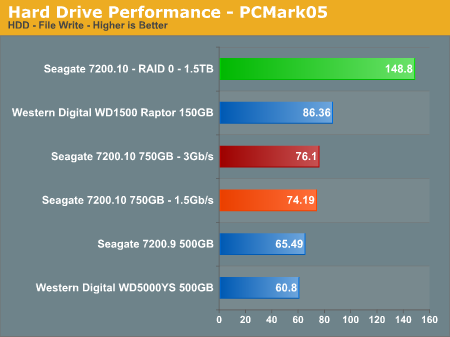
File Write: This test consists of 100% write activities by writing 680MB of files onto the hard disk.
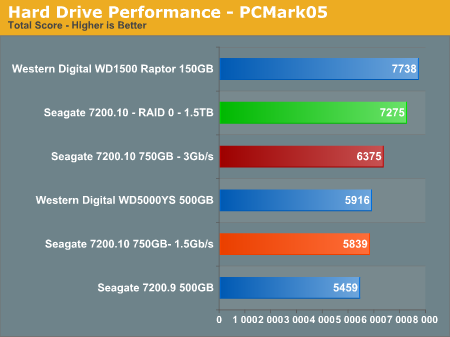
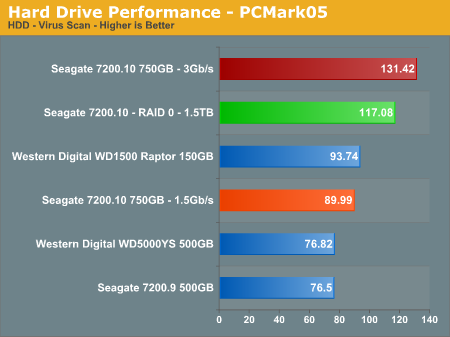
Our PCMark05 numbers follow the same trend with the WD Raptor having a 21% advantage over the Seagate 7200.10 750GB drive in the total score results. The performance delta of implementing SATA II/3Gb/s operation on the Seagate 750GB drive results in an impressive 9% gain over the SATA 1.5Gb/s results. However, after further examination of the numbers the only real improvement comes from the Virus scanning test which shows a 45% increase in the score. The other individual scores are well within the margin of error between benchmark sessions. In our IPEAK virus scan we did not witness the same results and believe the rather short sequential scan of 600MB in data favors the Seagate drive in this test.
The general usage and application benchmarks that represent the majority of daily operations on a typical PC configuration heavily favor the Western Digital drives. The Western Digital 500GB drive makes for an impressive showing in the first three benchmarks and then falls flat on its platter in the File Write test. The Raptor basically eats the competition in all of the benchmarks except the Virus Scan where we obviously have an aberration in the scores.
We have included the RAID 0 results for the Seagate 7200.10 drive array featuring 1.5TB of storage capability. We see a 13% increase in the XP startup benchmark, a 12% decrease in the application loading benchmark, a 1% increase in the general usage score, an 11% decrease in the Virus Scan score, and a 94% increase in the File Write results. As we have stated in previous articles the performance of RAID 0 will improve specific benchmarks but the overall performance in the general application benchmarks did not improve beyond the margin of error in these test results. Although PCMark05 is a very good benchmark, we still have to wonder exactly how the Virus Scan and File Write scores are generated based upon our test results.


44 Comments
View All Comments
JakeBlade - Friday, May 26, 2006 - link
Interesting that this drive has a MADE IN SINGAPORE label instead of Seagate's usual MADE IN CHINA junk.ElFenix - Friday, May 19, 2006 - link
no reason to upgrade from my SE16, i see.i'd like to see a couple more drives in tests, such as the latest hitachi.
Gary Key - Friday, May 19, 2006 - link
The reason we did not include the Hitachi unit is we have the revised 500GB unit arriving shortly and as mentioned in the article we will have a complete 500GB roundup with the new 7200.10 also. It will take some time to build the database with the revised test suite as we also have additional application timer tests coming shortly.
The performance across most of the recently released mainstream drives is so close now that it comes down to a personal decision on warranty, reliability, thermals/acoustics, and capacity for the most part. However, drives like the Raptor and RE2 series do make things interesting for SATA on the desktop as did this drive for a PVR fanatic. ;-)
ElFenix - Friday, May 19, 2006 - link
i'd also like to see audio tests from a little bit further away. 5 mm doesn't give a realistic idea of how loud it will be sitting 3 feet away on the floor. plus, for all i know where you place the microphone is extremely important when at 5 mm.Gary Key - Friday, May 19, 2006 - link
There is no one good area to measure the acoustics as you never know where the PC will be located, what type of case, fan noise, or ambient sounds are present. I can tell you that a drive that is loud at 3mm~5mm will be loud at three feet with all things being equal. Sound tones are also very subjective, the dull thumping sound the drive has under load might be perfectly acceptable while the higher pitched clicking sound of a Maxtor will be unbearable for some people.
We place the two mics at different points on the drive to ensure a consistent recording point, we assume most people will utilize a horizontal mounting point with the rear of the drive facing the case front, although we test the drive facing the case side also as this cage design is becoming very popular. The tone of the drive can change dramatically with the addition of rubber washers between the drive and the mount points.
Thanks for the comments. :)
jhvtoor - Friday, May 19, 2006 - link
Temperature measurement using S.M.A.R.T. is not reliable. The sensor and electronics on the harddrive are used, en they are not calibrated.
I am using the freeware "HDD Health" utility to monitor the SMART information. It reported the drive temperature of my desktop is 12 degrees celcius immediatly after winXP boot, while the room temperature is 19 degrees.... I am not using cooling techniques on this drive. This can only be explained by an inaccurate temperature measurement of this drive.
I would suggest to use one an independent measurement instument in the future. Attach the sensor in the middle of the cover plate.
Gary Key - Friday, May 19, 2006 - link
Hi,1. We have found S.M.A.R.T. to be "fairly" accurate along with our capture utility. We know it is not perfect but it allows us a consistent measurement of each drive in testing. In our 7200.10 test ActiveSmart reported a temperature of 26c after boot, room temp was 22c. We put the drive through 15 minutes of light usage, let it idle for 15 minutes, and then report this number as our idle number. All of the drives we have tested have followed the same pattern with a consistent idle reading after this usage, the idle temp will be the same 15 or 30 minutes later. If you stress the drive, you will see the temps rise accordingly and then fall back to the standing idle temp during the cooldown phase.
2. One drawback is the temperatures are not "real" time, there is a delay built in, this is why on the load test (also idle) we loop PCMark05 several times and then take the reported temperature at the end of the session, generally the high temperature was actually reached in the previous loop.
3. We have have tried using a sensor, infrared, and other methods with varying results. The problem is each section of the drive will report a different number. When we utilized a sensor on the top plate, the temps varied from drive to drive with the same model being tested. Each supplier uses different materials for their casings so that creates greater variables, it just is not consistent enough to report.
toattett - Thursday, May 18, 2006 - link
Apparently,If I want a speedy drive, I buy the raptor.
If I want a super large drive, I buy the new 750GB Seagate.
If I want good performance and good amount of stoarge, I buy the 500GB WD.
Missing Ghost - Thursday, May 18, 2006 - link
The pictures for the noise level are wrong. You put the dbA level as if it was a linear scale. It's not that way, the space between 0dB and 10dB should be smaller than the space between 10dB and 20dB. That way it will show more clearly the difference between the noise levels. It's a logarithmic scale.Gary Key - Thursday, May 18, 2006 - link
Our current graph engine will not allow us to do this type of scale manipulation. We will probably have to utilize a Microsoft Excel chart in the next article. We agree with you, just not possible with the internal engine at this time although we are working on a new one.