The iPhone XS & XS Max Review: Unveiling the Silicon Secrets
by Andrei Frumusanu on October 5, 2018 8:00 AM EST- Posted in
- Mobile
- Apple
- Smartphones
- iPhone XS
- iPhone XS Max
SPEC2006 Performance: Reaching Desktop Levels
It’s been a while now since we attempted SPEC on an iOS device – for various reasons we weren’t able to continue with that over the last few years. I know a lot of people were looking forward to us picking back up from where we left, and I’m happy to share that I’ve spent some time getting a full SPEC2006 harness back to work.
SPEC2006 is an important industry standard benchmark and differentiates itself from other workloads in that the datasets that it works on are significantly larger and more complex. While GeekBench 4 has established itself as a popular benchmark in the industry – and I do praise on the efforts on having a full cross-platform benchmark – one does have to take into account that it’s still relatively on the light side in terms of program sizes and the data sizes of its workloads. As such, SPEC2006 is much better as a representative benchmark that fully exhibits more details of a given microarchitecture, especially in regards to the memory subsystem performance.
The following SPEC figures are declared as estimates, as they were not submitted and officially validated by SPEC. The benchmark libraries were compiled with the following settings:
- Android: Toolchain: NDK r16 LLVM compiler, Flags: -Ofast, -mcpu=cortex-A53
- iOS: Toolchain: Xcode 10, Flags: -Ofast
On iOS, 429.mcf was a problem case as the kernel memory allocator generally refuses to allocate the single large 1.8GB chunk that the program requires (even on the new 4GB iPhones). I’ve modified the benchmark to use only half the amount of arcs, thus roughly reducing the memory footprint to ~1GB. The reduction in runtime has been measured on several platforms and I’ve applied a similar scaling factor to the iOS score – which I estimate to being +-5% accurate. The remaining workloads were manually verified and validated for correct execution.
The performance measurement was run in a synthetic environment (read: bench fan cooling the phones) where we assured thermals wouldn’t be an issue for the 1-2 hours it takes to complete a full suite run.
In terms of data presentation, I’m following of earlier articles this year such as the Snapdragon 845 and Exynos 9810 evaluation in our Galaxy S9 review.
When measuring performance and efficiency, it’s important to take three metrics into account: Evidently, the performance and runtime of a benchmark, which in the graphs below is represented on the right axis, growing from the right. Here the bigger the figures, the more performant a SoC/CPU has benchmarked. The labels represent the SPECspeed scores.
On the left axis, the bars are representing the energy usage for the given workload. The bars grow from the left, and a longer bar means more energy used by the platform. A platform is more energy efficient when the bars are shorter, meaning less energy used. The labels showcase the average power used in Watts, which is still an important secondary metric to take into account in thermally constrained devices, as well as the total energy used in Joules, which is the primary efficiency metric.
The data is ordered as in the legend, and colour coded by different SoC vendor as well as shaded by the different generations. I’ve kept the data to the Apple A12, A11, Exynos 9810 (at 2.7 and 2.3GHz), Exynos 8895, Snapdragon 845 and Snapdragon 835. This gives us an overview of all relevant CPU microarchitectures over the last two years.
Starting off with the SPECint2006 workloads:
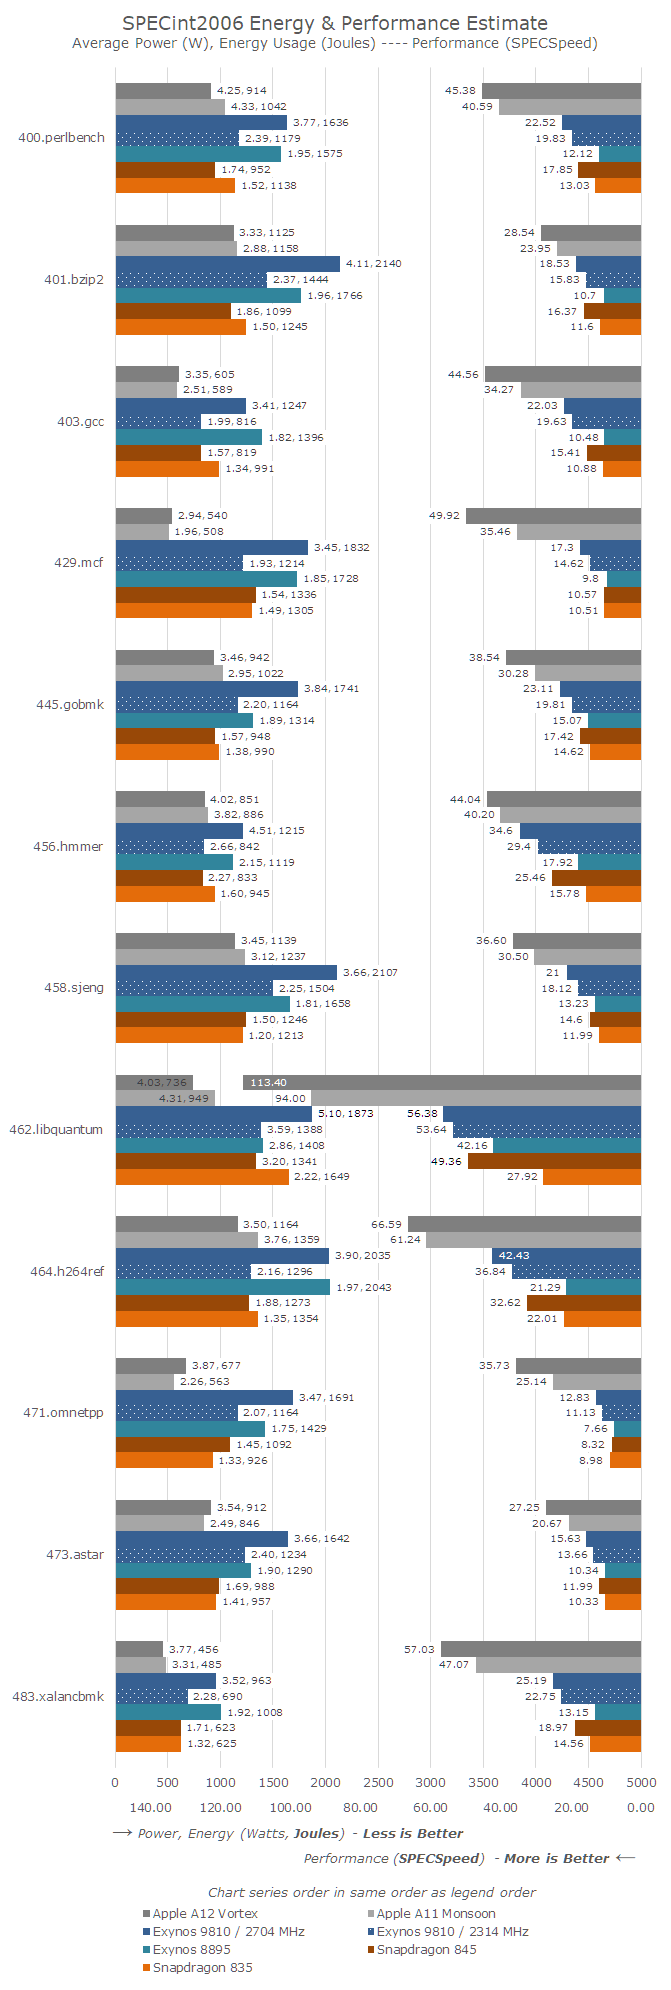
The A12 clocks in at 5% higher than the A11 in most workloads, however we have to keep in mind we can’t really lock the frequencies on iOS devices, so this is just an assumption of the runtime clocks during the benchmarks. In SPECint2006, the A12 performed an average of 24% better than the A11.
The smallest increases are seen in 456.hmmer and 464.h264ref – both of these tests are the two most execution bottlenecked tests in the suite. As the A12 seemingly did not really have any major changes in this regard, the small increase can be mainly attributed to the higher frequency as well as the improvements in the cache hierarchy.
The improvements in 445.gobmk are quite large at 27% - the characteristics of the workload here are bottlenecks in the store address events as well as branch mispredictions. I did measure that the A12 had some major change in the way stores across cache lines were handled, as I’m not seeing significant changes in the branch predictor accuracy.
403.gcc partly, and most valid for 429.mcf, 471.omnetpp, 473.Astar and 483.xalancbmk are sensible to the memory subsystem and this is where the A12 just has astounding performance gains from 30 to 42%. It’s clear that the new cache hierarchy and memory subsystem has greatly paid off here as Apple was able to pull off one of the most major performance jumps in recent generations.
When looking at power efficiency – overall the A12 has improved by 12% - but we have to remember that we’re talking about 12% less energy at peak performance. The A12 showcasing 24% better performance means were comparing two very different points at the performance/power curve of the two SoCs.
In the benchmarks where the performance gains were the largest – the aforementioned memory limited workloads – we saw power consumption rise quite significantly. So even though 7nm promised power gains, Apple's opted to spend more energy than what the new process node has saved, so average power across the totality of SPECint2006 did go up from ~3.36W on the A11 to 3.64W on the A12.
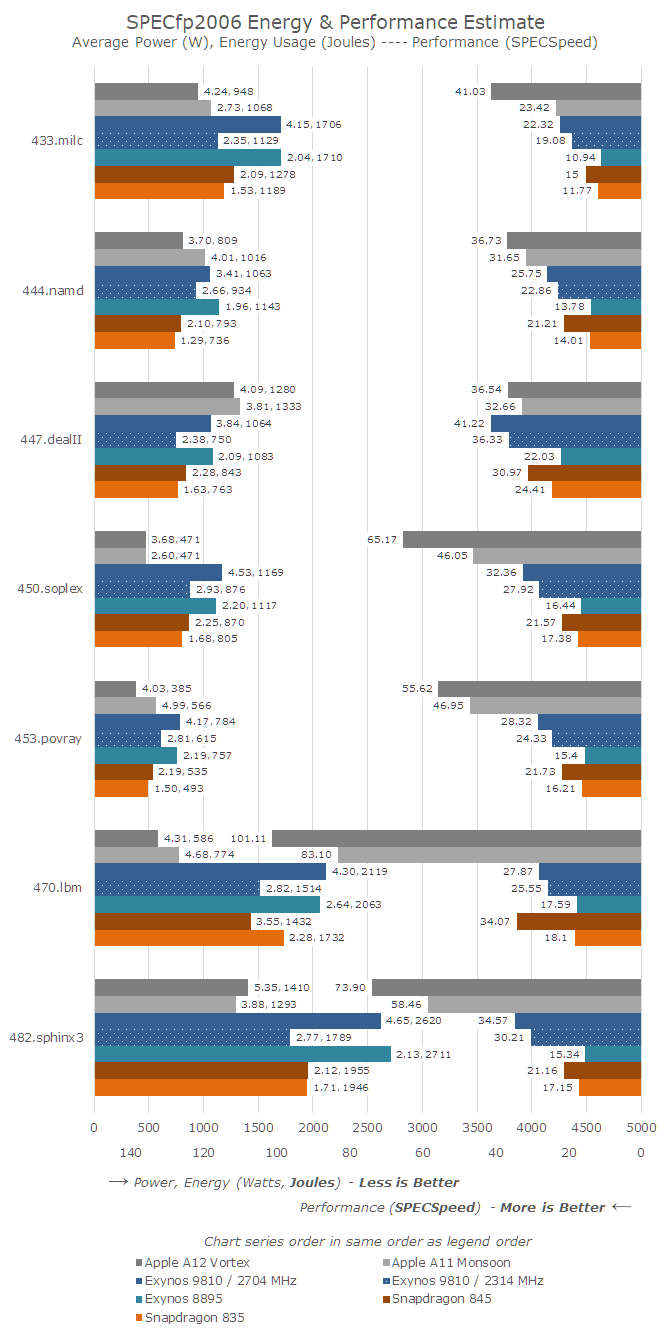
Moving on to SPECfp2006, we are looking at the C and C++ benchmarks, as we have no Fortran compiler in XCode, and it is incredibly complicated to get one working for Android as it’s not part of the NDK, which has a deprecated version of GCC.
SPECfp2006 has a lot more tests that are very memory intensive – out of the 7 tests, only 444.namd, 447.dealII, and 453.povray don’t see major performance regressions if the memory subsystem isn’t up to par.
Of course this majorly favours the A12, as the average gain for SPECfp is 28%. 433.milc here absolutely stands out with a massive 75% gain in performance. The benchmark is characterised by being instruction store limited – again part of the Vortex µarch that I saw a great improvement in. The same analysis applies to 450.soplex – a combination of the superior cache hierarchy and memory store performance greatly improves the perf by 42%.
470.lbm is an interesting workload for the Apple CPUs as they showcase multi-factor performance advantages over competing Arm and Samsung cores. Qualcomm’s Snapdragon 820 Kryo CPU oddly enough still outperforms the recent Android SoCs. 470.lbm is characterised by extremely large loops in the hottest piece of code. Microarchitectures can optimise such workloads by having (larger) instruction loop buffers, where on a loop iteration the core would bypass the decode stages and fetch the instructions from the buffer. It seems that Apple’s microarchitecture has some kind of such a mechanism. The other explanation is also the vector execution performance of the Apple cores – lbm’s hot loop makes heavy use of SIMD, and Apple’s 3x execution throughput advantage is also likely a heavy contributor to the performance.
Similar to SPECint, the SPECfp workload which saw the biggest performance jumps also saw an increase in their power consumption. 433.milc saw an increase from 2.7W to 4.2W, again with a 75% performance increase.
Overall the power consumption has seen a jump from 3.65W up to 4.27W. The overall energy efficiency has increased in all tests but 482.sphinx3, where the power increase hit the maximum across all SPEC workloads for the A12 at 5.35W. The total energy used for SPECfp2006 for the A12 is 10% lower than the A11.
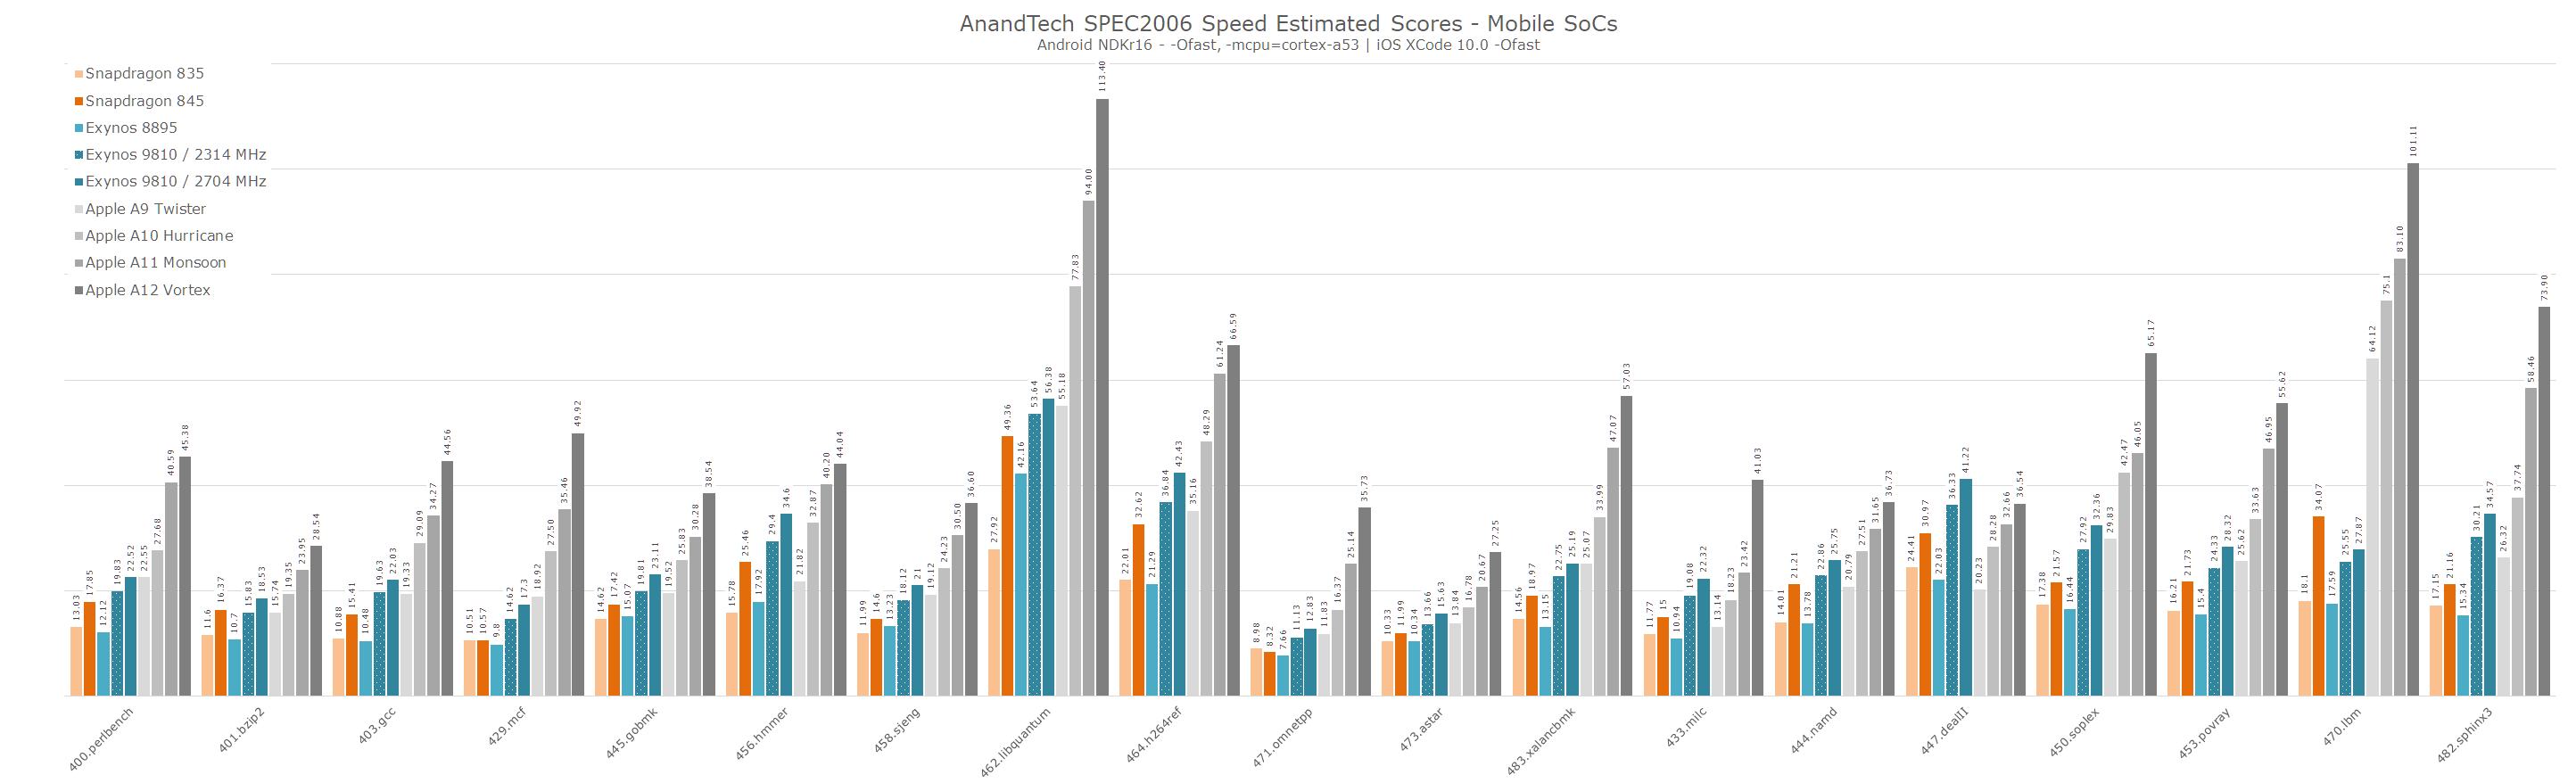
I didn’t have time to go back and measure the power for the A10 and A9, but generally they’re in line around 3W for SPEC. I did run the performance benchmarks, and here’s an aggregate performance overview of the A9 through to the A12 along with the most recent Android SoCs, for those who are looking into comparing past Apple generations.
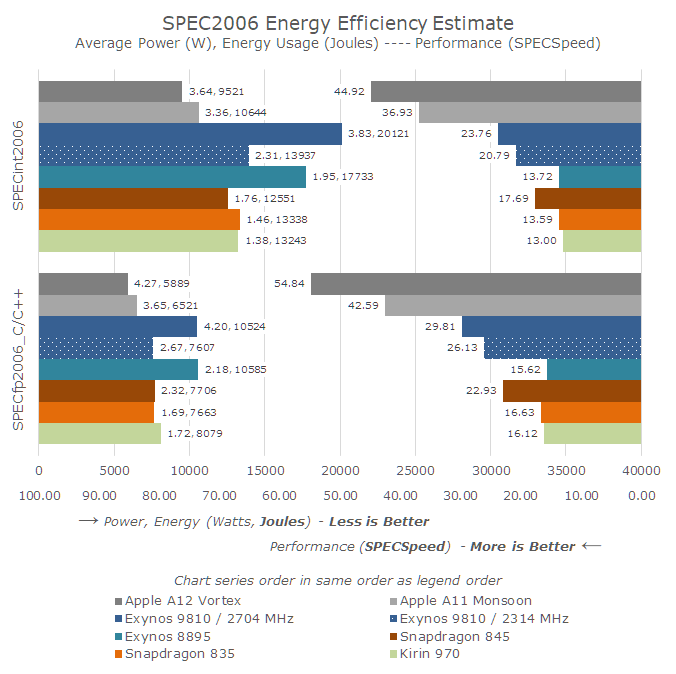
Overall the new A12 Vortex cores and the architectural improvements on the SoC’s memory subsystem give Apple’s new piece of silicon a much higher performance advantage than Apple’s marketing materials promote. The contrast to the best Android SoCs have to offer is extremely stark – both in terms of performance as well as in power efficiency. Apple’s SoCs have better energy efficiency than all recent Android SoCs while having a nearly 2x performance advantage. I wouldn’t be surprised that if we were to normalise for energy used, Apple would have a 3x performance lead.
This also gives us a great piece of context for Samsung’s M3 core, which was released this year: the argument that higher power consumption brings higher performance only makes sense when the total energy is kept within check. Here the Exynos 9810 uses twice the energy over last year’s A11 – at a 55% performance deficit.
Meanwhile Arm’s Cortex A76 is scheduled to arrive inside the Kirin 980 as part of the Huawei Mate 20 in just a couple of weeks – and I’ll be making sure we’re giving the new flagship a proper examination and placing among current SoCs in our performance and efficiency graph.
What is quite astonishing, is just how close Apple’s A11 and A12 are to current desktop CPUs. I haven’t had the opportunity to run things in a more comparable manner, but taking our server editor, Johan De Gelas’ recent figures from earlier this summer, we see that the A12 outperforms a moderately-clocked Skylake CPU in single-threaded performance. Of course there’s compiler considerations and various frequency concerns to take into account, but still we’re now talking about very small margins until Apple’s mobile SoCs outperform the fastest desktop CPUs in terms of ST performance. It will be interesting to get more accurate figures on this topic later on in the coming months.


253 Comments
View All Comments
Andrei Frumusanu - Friday, October 5, 2018 - link
Hello all,This article is still fresh off the presses - I'm sure there's still typos/grammar to be fixed in the coming hours.
Just a general note; this is my first iPhone review, and hopefully it makes up for AnandTech not having a review of the iPhone 8's/X last year. Unfortunately that happened in a time when there was no mobile editor with the site anymore, and I only rejoined after a few months after that.
As always, feel free to reach out in the comments or per emails.
OMGitsShan - Friday, October 5, 2018 - link
As always, this is the iPhone review to wait for! Thank you Andreiversesuvius - Friday, October 5, 2018 - link
Potato.Jetcat3 - Friday, October 5, 2018 - link
Wonderful review Andrei! Just a few minor quibbles for the capacities of each li-ion battery.Xs is 2658 mAh
Xs Max is 3174 mAh
Keep up the good work!
wicasapa - Friday, October 5, 2018 - link
one thing was not clear in the display section ... the Xs display (OLED) uses more power on a black screen compared to 8's LCD at the same brightness?!! this doesn't sound right! or is this power draw attributable to something else (face detection sensors, etc.)?Andrei Frumusanu - Saturday, October 6, 2018 - link
No, that's accurate. It's part of why the new phones regress in battery over the LCD iPhones.DERSS - Saturday, October 6, 2018 - link
You asked about the display's matrix controlling logic. It was found out through patent research that Apple has developed LTPO TFT Technology for that, however it is so far is confirmed to only used in the displays LG Display makes for Apple Watch. For smartphone OLEDs Apple has older simpler technology designed for the transistor layer as these big OLEDs are already super pricy anyway. And additional manufacturers like LG Display where Apple has started to implement manufacturing of iPhone XS/Max displays only has very few Tokki Canon equipment sets so they can not really low the manufacturing pricing down. (And Apple can not move to a different equipment as it has designed iPhone X/XS/Max displays only for Tokki Canon equipment).wicasapa - Saturday, October 6, 2018 - link
I understand the regression on the battery test you run, it is basically browsing the web, which is by and large a white background and generally above the 60-65% threshold for the crossover of efficiency between OLEDs and LCDs. it actually makes sense for OLEDs to be less efficient in web browsing-based battery tests. however, I was surprised that you measured less efficiency on a pure black screen!Andrei Frumusanu - Sunday, October 7, 2018 - link
Actually the web test is varied, I have a few lower APL sites and even some black ones.tipoo - Sunday, October 14, 2018 - link
Common misconception - OLEDS don't just turn off fully for pure blacks, it takes active power to create a black. When they're off they're a murky grey.