Choosing the Right SSD for a Skylake-U System
by Ganesh T S on May 9, 2016 8:00 AM ESTPCMark 8 Storage Bench
Futuremark's PCMark 8 evaluates the performance of PCs with a variety of benchmarks for different use-case scenarios. We usually present the scenario scores in all our system reviews. It is similar to the SYSmark 2014 scoring in terms of presenting overall effectiveness of the system for day-to-day activities. However, PCMark 8 also includes a dedicated storage benchmark suite.
The PCMark 8 Storage test simulates disk activity by playing back a trace of storage activity recorded during actual use of applications from the Adobe Creative Suite, Microsoft Office and a selection of popular games. Idle time compression is is avoided to make the benchmark behave more like real-world applications. The benchmark keeps track of the time taken to complete playback of the trace (termed as the primary result). The secondary result is the total amount of data transferred (both reads and writes) divided by the storage I/O busy time (i.e, time duration during which the number of pending I/O operations was at least 1). The secondary result is a very important metric when idle time compression is involved, but it doesn't matter as much as the primary result when it comes to application responsiveness (as the workload might be CPU-bound, rather than storage-bound).
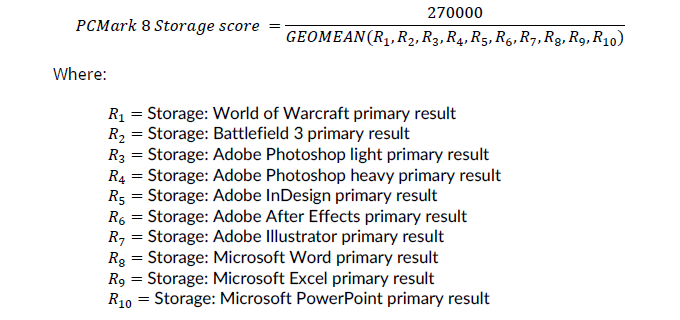
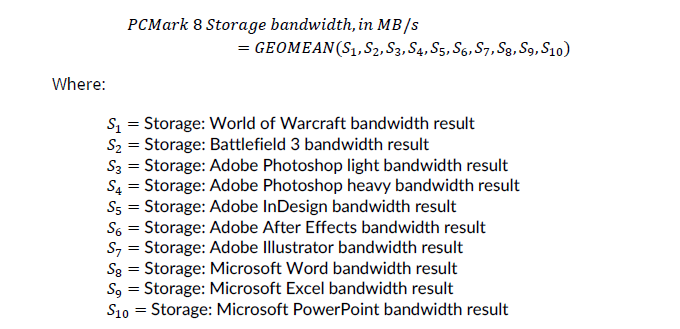
PCMark 8's technical guide (PDF) explains the formulae used to arrive at the benchmark scores that are presented in the two graphs below.
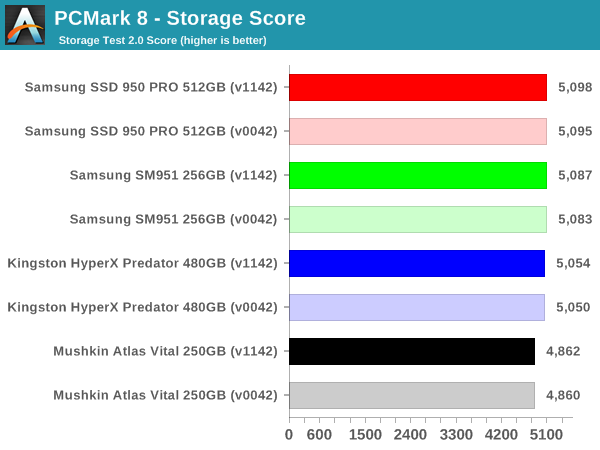
The storage scores reflect what we saw in the SYSmark 2014 results. When it comes to SATA vs. PCIe, there is a significant difference (translates to approximately 1 - 2s differences in the time taken to complete each of the storage traces). However, between AHCI and NVMe, there is not much to choose. In fact, the difference of 30 to 40 points comes from differences as low as 0.1s - 0.4s in the time taken to complete each of the traces. In real-world situations, it is our opinion that this is indiscernible to the end-user.
A detailed breakdown of the time taken to complete each trace for different SSDs in the Skylake NUC6i5SYK using BIOS v1142 is available in the exported storage bench results linked below.
- Mushkin Atlas Vital 250GB (PDF)
- Kingston HyperX Predator 480GB (PDF)
- Samsung SM951 256GB (PDF)
- Samsung SSD 950 PRO 512GB (PDF)
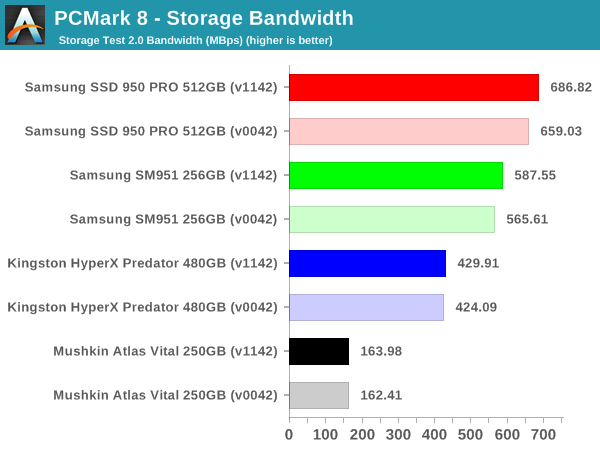
The bandwidth numbers, on the other hand, show that there is a lot to gain by going from SATA to PCIe, and from AHCI to NVMe, and from PCIe 2.0 to PCIe 3.0. However, the gains obtained in each of these upgrades becomes progressively smaller. Current PC usage models (typical of what one might do with a Skylake-U system) have minimal benefit from moving to NVMe or PCIe 3.0 when it comes to application responsiveness.


40 Comments
View All Comments
sorcio46 - Monday, May 9, 2016 - link
Is there a reason why these flash SSDs have a lower 4K read speed compared with 4K write?James5mith - Monday, May 9, 2016 - link
My guess is writes are buffered vs. reads straight from the raw NAND. But I have no idea if it's actually true.hojnikb - Monday, May 9, 2016 - link
More or less this.rossjudson - Thursday, May 12, 2016 - link
Flash drives use variations on log-structured storage. The basic thing going on is that the *logical* block numbers being written (which are random) are not the same as the *physical* blocks being written. Drives create 0-N append points, and all those random writes end up becoming sequential writes to pages. At the high end, your write rate can get limited by the page erase rate, which basically translates to an energy/thermal issue (it takes a fair bit of power to erase flash memory pages). The best high end drives can sustain very high mixed read/write rates -- and the key is "sustain" -- for hours/days. Lots of drives out there can handle a short burst of activity for a few tens of seconds, caching everything in RAM on the hardware until the RAM runs out.Random reads are tougher, because you actually have to go to a random storage block and pull the data. Sequential reads admit lookahead, but random reads don't.
Kristian Vättö - Monday, May 9, 2016 - link
Small writes are cached to DRAM for write combining i.e. multiple IOs are written to NAND at once as the IOs are smaller than the page size. Once the IOs hit the DRAM cache, they are considered complete, hence the higher speed.dzezik - Thursday, May 12, 2016 - link
SF-2281 has no DRAM. this is not a DRAM cache. the old SandForce 2281 was designed for SLC. the performance with MLC is medicorebug77 - Monday, May 9, 2016 - link
And I'm going to make this point again: if even when using NVMe, your random reads are still limited at ~50MB/s, you're only missing on sequential transfers if you stick with AHCI and SATA. Because right now, the bottleneck is elsewhere.Also, for Skylake-U (mobile), SATA offers lower standby power.
Kristian Vättö - Monday, May 9, 2016 - link
50MB/s is a ~50% upgrade over ~30MB/s that SATA offers. It's not even close to what HDD to SSD offers, of course, but we will have to wait for next generation memory for the next huge upgrade.bug77 - Monday, May 9, 2016 - link
SATA can do better than ~30MB/s (not sure whether Skylake-U limits the performance in any way, however).NVMe/PCIe still makes sense, because the price premium is not that large. But I'd like to see more reviews highlighting that if you need to save ~$20, going AHCI/SATA is a better option than getting a smaller drive.
vladx - Monday, May 9, 2016 - link
Price premium is not large? LMAO it's almost double over SATA ones.