Original Link: https://www.anandtech.com/show/2304
We recently provided a brief overview of the MTRON 32GB SSD provided by DV Nation and found its performance on the desktop to be very robust in most tests. In fact, it competed very well against the Western Digital Raptor 150GB drive in the application benchmarks and just annihilated it in the FutureMark PCMark05 benchmarks. Besides the MTRON's excellent performance and excessive costs, we also discovered an issue with the latest Intel desktop chipsets that feature the ICH9 or ICH8 Southbridges.
Our first indication of a problem was during our theoretical throughput tests featuring HD Tach that showed the NVIDIA 680i SLI MCP generating a sustained transfer rate of 95.1 MB/sec, write speeds of 74.7 MB/sec, and a burst rate of 100.4 MB/sec. The same MTRON drive on the Intel P35/ICH9R scored a sustained transfer rate of 79.4 MB/sec, write speeds of 67.2 MB/sec, and a burst rate of 82.7 MB/sec.
Utilizing the NVIDIA 680i MCP showed a 17% improvement in sustained transfer rates, 11% improvement in write speeds, and a 21% increase in burst rates. PCMark05 showed improvements up to 88% while our current application benchmarks show anywhere from a 1% to 20% gain over the Intel ICH9R. We still do not have an answer as to why the latest Intel Southbridges cap sustained transfer rates to around 80 MB/sec with the SSD drives but should have one soon.
We received numerous requests (we are still responding for those awaiting answers) after our original MTRON article to show additional test results on a notebook platform. We were already in the process of testing this drive with our new Vista based testbed and application test suite as part of a 2.5" drive roundup so we will provide a few initial results today.
Of course, nothing is ever as easy at it seems and what can go wrong will go wrong. During preliminary testing we discovered the same throughput issues with the Intel PM965/ICH8-M combination used in the latest Crestline based notebooks. After several reloads, new driver combinations, and praying to the Intel gods we still have the same problem and possibly more. Our current NVIDIA and ATI chipset based notebooks do not have this same cap and it turns out an older 945PM/ICH7 unit we had is fine.
Not only were we having the 80 MB/sec cap issue with the MTRON unit but our SanDisk 32GB SSD unit seemed to be capped at 26 MB/sec compared to the 60.7 MB/sec capability on the NVIDIA GeForce Go 6150 platform. Our Samsung Hybrid drive decided to chime in and give us some of the most inconsistent test results we have ever experienced, but that was cleared up with a new BIOS release, or so we hope as the benchmarks roll on. Also, our SanDisk 32GB SSD drive is reporting random access times around 14ms on both platforms compared to the .1ms results on our other SSD drives. We are still investigating these problems, but just in case we have a new PM965/ICH8-M platform and SanDisk 32GB drive arriving on Monday for additional analysis.
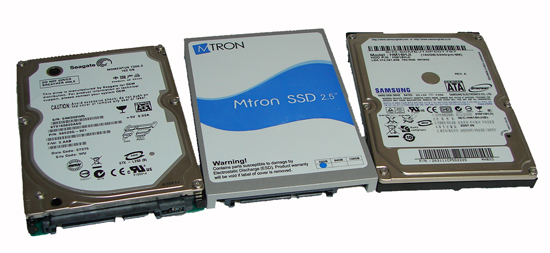
Our quick take today is based on a limited test suite using Vista Home Premium and an NVIDIA/AMD based notebook platform. We will follow up in our 2.5" drive roundup with full test suite results on both the Intel and AMD CPU based platforms. In the meantime, let's take a quick look at this MTRON drive and see how it compares to our review units from Samsung and Seagate in the notebook sector.
Hard Disk Test Comparison and Features
| Hard Drive Specifications | |||
| MTRON SSD 32GB MSD-SATA6025 |
Seagate Momentus 7200.2 160GB ST9160823ASG |
Samsung MH80 FlashON 160GB HM16HJI |
|
| Manufacturer's Stated Capacity | 32 GB | 160 GB | 160 GB |
| Operating System Stated Capacity | 30.9 GB | 149.05 GB | 149.05 GB |
| Interface | SATA 1.5Gb/s | SATA 3Gb/s | SATA 1.5Gb/s |
| Rotational Speed | n/a | 7,200 RPM | 5,400 RPM |
| Cache Size | n/a | 8 MB | 8 MB DRAM Buffer, 256 MB oneNAND Flash buffer |
| Read Seek Time | .1 ms | 14.1 ms | 18.9 ms |
| Number of Heads | n/a | 4 | 4 |
| Number of Platters | n/a | 2 | 2 |
| Power Draw Idle / Load | .15W / .55W | .87W / 2.89W | .85W / 2.27W |
| Acoustics Idle / Load | 0 dB(A) / 0 dB(A) | 27 dB(A) / 33 dB(A) | 26 dB(A) / 30 dB(A) |
| Thermals Idle / Load | 29C / 31C | 33C / 39C | 33C / 37C |
| Write/Erase Endurance | >140 years at 50GB Write/Erase Cycles per Day |
- | - |
| Data Retention | 10 years | - | - |
| Command Queuing | n/a | Native Command Queuing | Native Command Queuing |
| Warranty | 5 Years | 5 Years | 3 Years |
The MTRON MSD-SATA6025-032 features a capacity of 32GB with sizes ranging from 4GB to 32GB in the 2.5" form factor and up to 128GB in the 3.5" form factor. The 32GB drive sells for approximately $1499 in the US, although pricing in the Asian markets have dropped below $1000 now. We will go into more detail about the Seagate and Samsung drives in our 2.5" drive roundup.
Briefly, our Samsung HM16HJI drive is the first available Hybrid drive in the notebook market and features a 256MB NAND flash buffer that is utilized as a ReadyDrive device in Vista. The Seagate Momentus is one of the faster pure mechanical 2.5" hard drives in the market today. We say one of the faster as early testing with the new Hitachi Travelstar 7K200 indicates that Seagate has some catching up to do from a performance viewpoint now.
Our thermal, acoustic, and power numbers are based upon actual readings in our AMD/NVIDIA based Hewlett Packard Pavilion dv9000z testbed. We still have several additional tests to generate with an Intel based platform and will report those results in a future article.
Hardware Setup
| HP Pavilion dv9000z Laptop Storage Test Bed |
|
| Processor | AMD Turin X2 - TL-60 (2.0GHz Dual Core) |
| Chipset | NVIDIA GeForce Go 6150 / nForce 430 |
| RAM | 2 x 2GB PC2-5300 Settings: DDR2-667 - 5-5-5-18 |
| OS Hard Drive | 1 x Seagate Momentus 7200.2 160GB |
| System Platform Drivers | NVIDIA 5.53a |
| Video Card | 1 x GeForce G0 6150 |
| Video Drivers | NVIDIA ForceWare 7.15.10.9815 |
| Optical Drive | SuperMulti 8X DVD+/-R/RW |
| Display | 17" WVGA+ HD-Ultra |
| Operating System | Vista Home Premium - 32-bit |
The notebook test bed we are utilizing today features the Hewlett Packard Pavilion dv9000z that features the AMD Turin X2 TL-60 CPU running at 2.0GHz. We are utilizing a 4GB memory configuration that is now standard in our test beds. The system is equipped with the NVIDIA GeForce Go 6150 GPU that includes the nForce Go 430 chipset logic. Our desktop resolutions are set to 1440x900 with our gaming tests run at 1024x768 resolutions with Medium Quality settings. Windows Vista Home Premium is fully updated and we load a clean drive image for each platform to keep driver conflicts to a minimum.
The review drive is formatted before each test run and five tests are completed on each drive in order to ensure consistency in the benchmark results for the individual test results. The high and low scores are removed with the remaining score representing our reported result. We utilize the latest drivers and BIOS available from the manufacturer to ensure consistency in our playback results. The Windows Vista swap file is set to a static 2048MB and we clean the prefetch folder after each benchmark run. Battery life tests will be available in the 2.5" drive roundup.
HD Tach 3.0 Performance
MTRON 32GB SSD
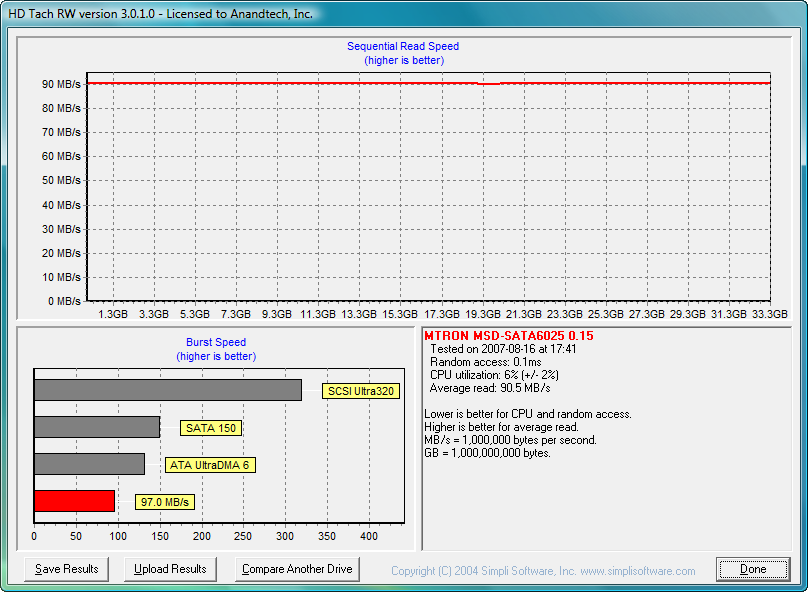 |
| Click to enlarge |
Seagate Momentus 7200.2 160GB
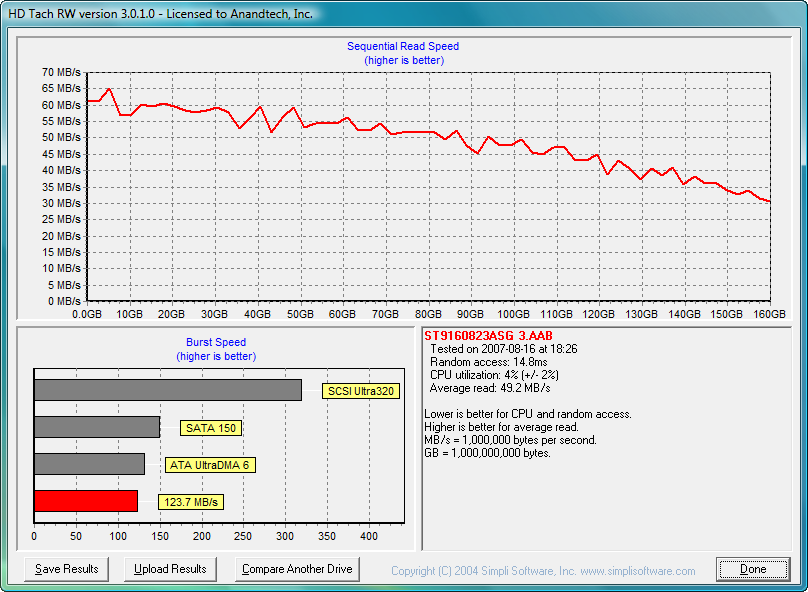 |
| Click to enlarge |
Samsung MH80 FlashON 160GB
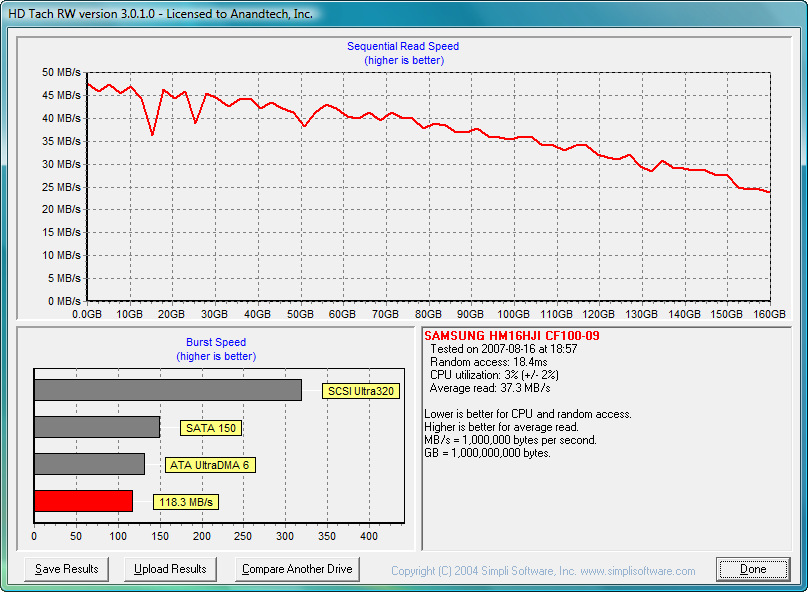 |
| Click to enlarge |
Our first screenshot is the MTRON drive and indicates a sustained transfer rate of 90.5 MB/sec with a burst rate of 97 MB/sec and a outstanding access time of 0.1ms or lower. The same drive on a Intel T7100 (1.8GHz) PM965/ICH8 platform scores a sustained transfer rate of 79.3 MB/sec with a burst rate of 82.5 MB/sec. The Intel controller is up to 14% slower with the MTRON SSD drive in this particular benchmark and follows the same pattern as the Intel desktop chipsets.
Our Seagate drive features sustained transfer rate of 49.2 MB/sec, burst rate of 123.7 MB/sec, and random access speed of 14.8ms. With a slower 5400rpm spindle speed, the Samsung drive provides a sustained transfer rate of 37.3 MB/sec, burst rate of 118.3 MB/sec, and random access speed of 18.4ms. While these numbers are significantly lower than the MTRON SSD, the performance differential in actual application benchmarks will be tempered somewhat by the platform components.
Actual Application Performance
Our application benchmarks are designed to show application performance results with times being reported in seconds, with lower scores being better. While these tests will show differences between the drives it is important to understand we are no longer measuring the synthetic performance of the hard drive but how well our test platforms perform with each individual drive. The performance of a drive is an integral part of the computer platform but other factors such as memory, CPU, core logic, and even driver choice can play a major role in determining how well the drive performs in any given task.
Adobe Photoshop CS2
We utilize the WorldBench 6.0 test script that applies an extensive series of filters to the test image. CPU, memory, and chipset speed factor heavily in this particular test but we have found this test to be good for hard drive access performance as Photoshop relies heavily on its "paging file" to improve performance.
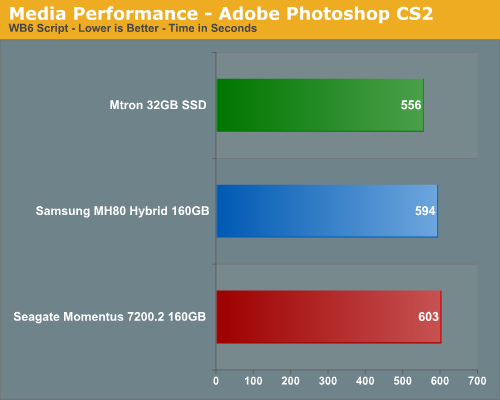
We have seen performance gaps between desktop drives, especially in RAID setups, with this particular test and there was no difference here as the MTRON SSD is about 8% faster than the other drives.
Game Level Load
The Battlefield 2 test measures the time it takes to load the Daqing Oilfields level. Our application timer begins when the start single player icon is initiated and ends when the join game icon is visible.
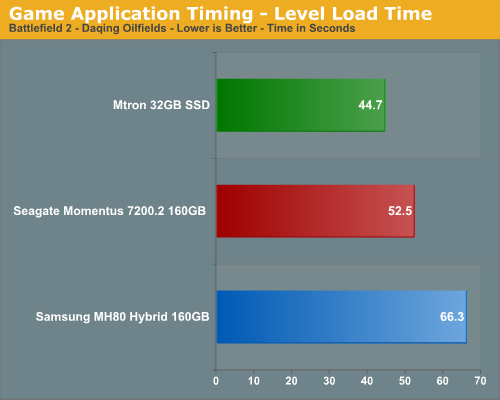
This is one of the more demanding game level load times we test currently and the MTRON drive is around 33% faster than the Samsung drive and 15% faster than the Seagate drive. We could definitely tell a difference between the drives in this test over the course of two gaming sessions. The MTRON SSD product loaded the levels in a smoother manner than our Seagate drive although it was difficult to determine any differences with the Samsung drive except when first starting the game.
Nero Recode
Our encoding test is quite easy - we fire up Nero Recode 2, select our Office Space copy on the hard drive, and perform a shrink operation to allow the entire movie along with extras to fit on a single 4.5GB DVD disc. We leave all options on their defaults except we turn off the advanced analysis option. The scores reported include the full encoding process and are represented in seconds, with lower numbers indicating better performance.
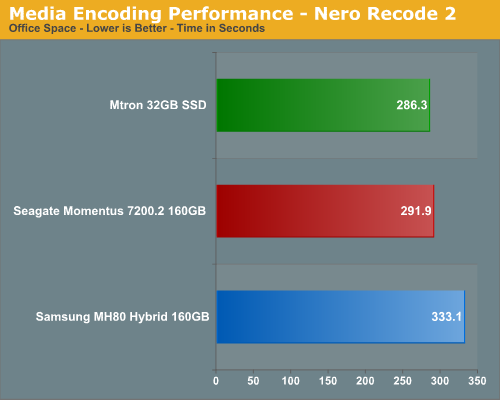
This test is primarily dependent on CPU performance but the write performance of a drive can make small but measurable differences in completion times. As in our HDTach tests, the write performance of the MTRON drive is slightly better than the Seagate and Samsung drives. Our results show the same pattern with the MTRON being 3% faster than the Seagate drive and a surprising 15% better than the Samsung drive.
We expected the NAND flash memory on the Samsung drive and Vista's ReadyDrive feature to compensate for its 5400RPM spindle speed in this test that features large sequential block sizes. The Samsung drive had the highest variation of encoding frames per second. It was an obvious buffer overflow pattern as the frames per second would start at 1100+ and as the buffer filled up the fps would sometimes drop to under 400 and then steadily increase back to the 1100 level before repeating the pattern. The other two drives held a steady fps average throughout this test with the fps variation never being more than 5%. It appears to us there is still some firmware management tuning between the two buffers that need to occur on the Samsung drive for large sequential data block sizes.
WinRAR 3.70
Our WinRAR test measures the time it takes to compress our test folder that contains 444 files, 10 folders, and 602MB of data. While the benchmark is CPU intensive for the compression tests it still requires a fast storage system to keep pace with the CPU. A drive that offers excellent write performance can make a slight difference in this benchmark.
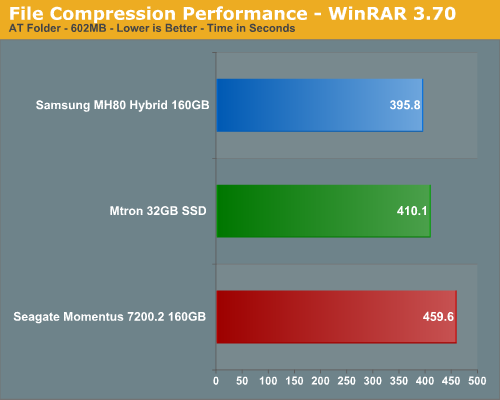
This test relies on the CPU and also the burst rates of the storage system. The Samsung drive obviously thrives on small sequential data block writes as its cache buffers more than make up for the lower spindle and higher access times. Our Samsung unit is 4% quicker than the MTRON unit and 145 better than the Seagate drive.
File Copy Performance
Our file copy test measures the time it takes to transfer our test folder that contains 29 files, 1 folder, and has 7.55GB of data from our source drive to the target test drive. This benchmark is disk write intensive and requires a fast storage system.
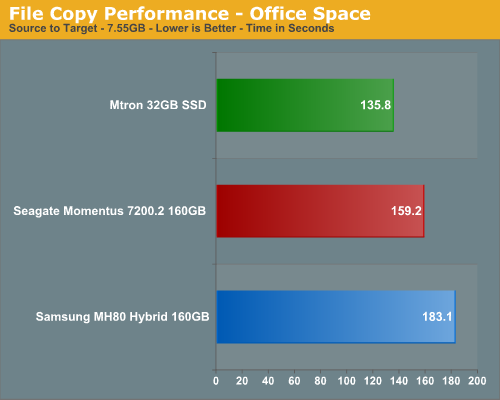
We finish our application tests with a benchmark that favors the MTRON's higher write speeds. As in Nero Recode, where the largest differences in scores were generated with large sequential data block writes, we see the Samsung drive being up to 27% slower than the MTRON drive and 14% when compared to the Seagate unit. However, we find it hard to fault the Samsung drive considering most portable users will be using applications that usually generate small sequential or out-of order data blocks. These type of read or write patterns is something the Samsung drive excels at in initial testing.
Operating System Performance
The following tests are designed to indicate the drives ability to load and shutdown Windows Vista Home Premium along with entering and resuming from hibernation.
Windows Vista Standby and Resume
These tests are fairly straight forward with our application timer measuring the time it takes for Windows Vista to enter standby with Excel and Photoshop Elements active with a large spreadsheet and several test images open. The Resume test measures the time it takes for the system to return to the desktop once the resume process is initiated.
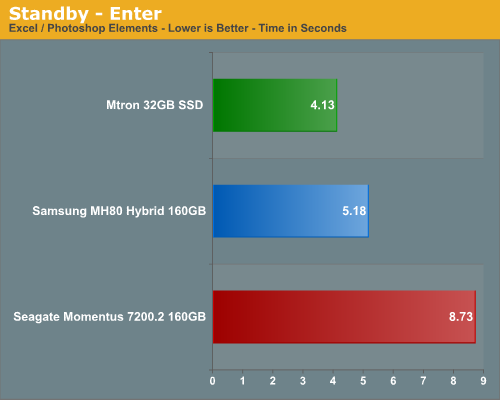
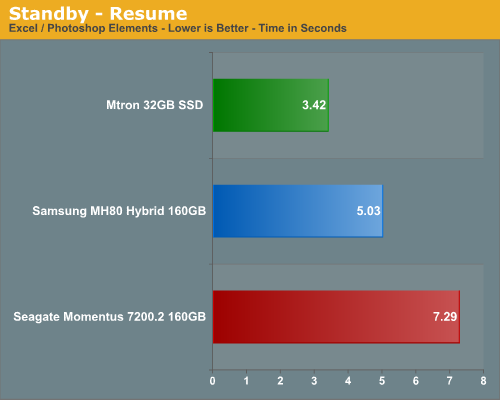
This test is dependent on write speeds for the standby section and read speeds for the resume operation. Windows Vista has been highly touted for its ability to use internal flash memory to write and store data for immediate retrieval via ReadyDrive so we should see some benefits with the Samsung drive.
In our standby tests, the Samsung Hybrid drive is only a second slower than the MTRON unit. Our MTRON drive is over 4 seconds faster than the Seagate drive at entering standby which is 111% faster (it sounds very impressive using that measurement technique). Our resume tests follow the same pattern with the MTRON unit being almost 4 seconds faster than the Seagate drive and about a second and a half faster than the Samsung drive. Our initial test results show promise for the hybrid drive design and Windows Vista.
Windows Vista Hibernate and Resume
Our Hibernate test measures the time it takes for Windows Vista to enter hibernation with Excel and Photoshop Elements active with a large spreadsheet and several test images open. The Resume test measures the time it takes for the system to resume to the desktop and includes the POST time of our notebook unit.
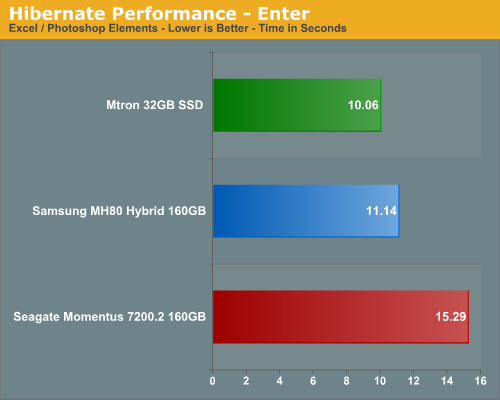
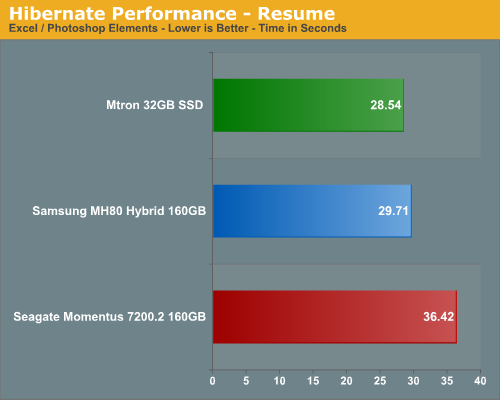
Our MTRON SSD unit is able to enter hibernation 15% faster than the Samsung and 52% quicker than the Seagate unit. Actual hibernate times of the MTRON unit are just over 1 and 5 seconds quicker than the Samsung and Seagate drives respectively. The MTRON SSD resumes 4% faster than the Samsung and 28% faster than the Seagate drive. Based upon the advantages of low latencies and always on capability we expected these results with the SSD based drive but were pleasantly surprised by the performance of the Samsung Hybrid drive.
The resume results indicate the advantages of the SSD design in not having a mechanical spin-up and seek process along with increased access times in locating files. The Hybrid design compensates for the most part compensates by mitigating the slower mechanical operation with the large 256MB NAND flash buffer and Vista's ReadyDrive capability.
Quick Take
We can see now why a fast Solid State Drive should be on your preferred option list for a notebook, provided you can afford one at this time. Their overall performance is unequaled across a variety of applications and the notebook platform benefits the most from their lack of noise, low thermals, and absence of moving parts for those who are a bit heavy handed with their portables. In initial energy management testing we are finding the SSD drives to be power misers to a certain degree although not as good as we expected or advertised.
Of course, the primary drawback continues to be the cost for the faster SSD drives with prices ranging anywhere from $500 for the SanDisk 32GB to almost $1500 for the MTRON 32GB SSD based upon your location. We have already noticed prices for the MTRON unit under $1000 in the Asian market sector and hopefully those same prices will be available shortly in other markets.
We have not had a lot of test time with the latest Samsung MH80 HM16HJI 160GB Hybrid drive but our initials impressions are very favorable based upon the price to performance ratios. These Hybrid drives, when combined with Vista (another story for another time), make for a very good combination for the typical notebook user. The drives performance in most standard office and home applications has been excellent in early testing although it is not a drive designed for heavy write activities like video encoding or large file transfers.
In the end, we are starting to finally see some true technological improvements in the storage sector that will benefit the user. Hopefully, mass market acceptance of the "fast" SSD drives will occur quickly so prices decrease and the manufacturers continue to innovate with not only faster drives but ones with the capacity to match current mechanical drives. In the meantime, it appears the Hybrid drives at this stage in the game will be a decent compromise for the portable market, but only until the SSD drives increase capacity and decrease costs.


