Original Link: https://www.anandtech.com/show/2167
Western Digital WD740ADFD: Bottled Lightning
by Gary Key on February 7, 2007 3:30 AM EST- Posted in
- Storage
The original Western Digital Raptor was launched as the WD360GD in March of 2003 with an enterprise level 10,000 RPM spindle speed, SATA interface, 8MB buffer, 5.2 millisecond read seek time, and a single-platter design featuring 36GB of storage. While it shined in single-user performance, the drive did not fare well against its SCSI-based competitors in the enterprise server market for which it was designed. Its already small size and complete lack of command queuing abilities delivered performance that was not on par with the SCSI drives in the critical multi-user applications. However, due to the lack of entry level SCSI drives, a growing interest in SATA components, and a very avid computer enthusiast market, the drive was able to succeed until its replacement arrived.
The next version of the Raptor was launched as the WD740GD in December of 2003 and boasted several needed enhancements. These enhancements included the addition of another platter that increased the capacity to 74GB, 4.6 millisecond read seek time, a FDB based motor to address noise concerns, and ATA-4 tagged command queuing. While TCQ was a welcome addition and certainly improved the drive's I/O operations, it still was not a match for most SCSI drives in the enterprise market. This was primarily due to a lack of SATA controllers that fully supported TCQ and firmware that was not as mature as the SCSI competition.
However, this drive was - and in certain cases continues to be - consistently one of the faster single-user performance drives available. The computer enthusiasts flocked to the drive due to its performance advantages, but the drive continued to have limited success in the enterprise server market. In a nod to the success of the drive in the computer enthusiast market and acceptance of its importance, Western Digital offered the drive in retail stores for a short time. Over the course of the last couple of years, the 8MB cache drive has been enhanced with minor revisions with one of the latest versions, WD740GD-00FLC0, receiving tweaks that significantly improved its performance in single-user applications.
The last major update to the Raptor family occurred in January of 2006 when the WD1500ADFD was launched with a significant list of improvements. The drives still sported the familiar 10,000 RPM spindle speed, 4.6ms read seek time, and a two-platter design now at 150GB capacity. The platter's density was increased to 75GB+ and equals those of several 10,000 RPM SCSI competitors. The buffer size was doubled to 16MB, matching the latest offerings from other drive manufacturers. An OEM version of this drive was made available by Dell that sported a 160GB capacity. WD also introduced a limited edition Raptor-X that featured the 150GB version with a crystalline polycarbonate based transparent cover over the spindle and platter section of the drive.
The Marvell 88i8030 PATA to SATA bridge chip that was used on the previous Raptors was finally dropped in favor of a native SATA implementation. This native SATA implementation brings with it Native Command Queuing instead of the legacy firmware-level Tagged Command Queuing. While NCQ can have a favorable impact in multi-user applications, it can create a performance penalty in certain single-user applications. Since the drive is still targeted towards the server market, it retains the first generation 150MB/sec SATA interface instead of the 300MB/sec SATA interface found in most of the current consumer level drives.
The WD1500ADFD also introduced Time Limited Error Recovery (TLER) and Rotary Acceleration Forward Feed (RAFF) operations to the Raptor product family. TLER allows the drive to signal the RAID host adapter in the event an error recovery process has exceeded timeout parameters. This prevents false drive dropouts on the host adapter when utilizing RAID level 1 or above configurations. Although TLER is disabled by default, a utility is available from Western Digital to enable TLER. RAFF is an electronics feature that senses rotational vibration in a multi-drive setup and then compensates for it by controlling the drive head location. This feature is designed to keep read and write operations consistent, thus avoiding time consuming retries by the drive that could impact performance.
The latest updates to the Raptor family occurred last fall when Western Digital offered the same features introduced on the WD1500ADFD on its 74GB and 36GB drives. The current WD740ADFD also sports a single platter design now instead of the previous two platter design in the older series. We will be taking an abbreviated look at the WD740ADFD today as we received numerous comments and emails inquiring about the performance of this drive. Our next storage review featuring several of the latest 500GB drives will include full performance results of this drive and its smaller sibling, the 36GB Raptor WD360ADFD. For now, we think the performance results we will present today should give a clear indication of the drive's performance.
Feature Set: WD Raptor WD740ADFD
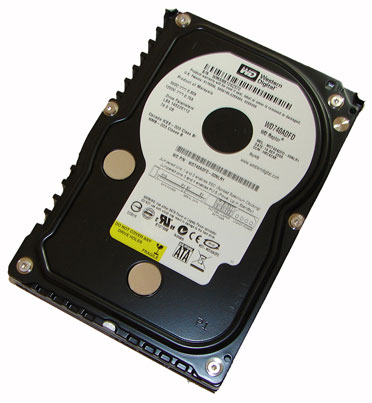
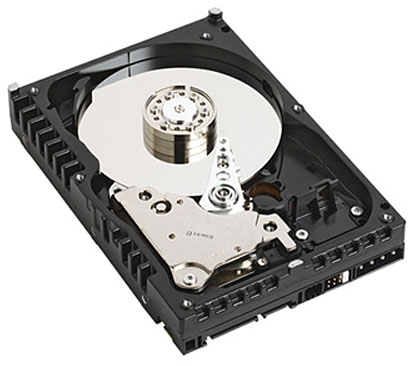
The external design of the Western Digital Raptor series is the same as the majority of their SE16 and RE2 offerings. The familiar all black casing gives the drive a Darth Vader presence in the system as does its performance. The drive is based on the industry standard 3.5" form factor platform with pertinent part number and warranty information embossed on a white sticker on the top of the casing.
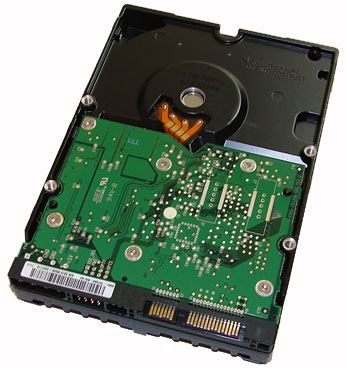
The current Raptor family ships with the SATA data and power connectors along with a 4-pin Molex power connector designed for use with older ATX power supplies. To the left of the SATA data and power connectors is an eight-pin jumper block. This jumper block can be utilized to implement spread spectrum clocking or power up in stand by operation. Our test drive was manufactured in Malaysia.
Hard Disk Test Comparison and Features
| Hard Drive Specifications | ||
| WD Raptor 150GB WD1500ADFD |
WD Raptor 74GB WD740ADFD |
|
| Stated Capacity: | 150GB | 74GB |
| OS Capacity: | 139.73 GB | 69.24 GB |
| Interface: | SATA 1.5Gb/s | SATA 1.5Gb/s |
| Rotational Speed: | 10,000 RPM | 10,000 RPM |
| Cache Size: | 16 MB | 16 MB |
| Average Latency: | 2.99 ms (nominal) | 2.99 ms (nominal) |
| Read Seek Time: | 4.6 ms | 4.6 ms |
| Number of Heads: | 4 | 2 |
| Number of Platters: | 2 | 1 |
| Power Draw Idle / Load: |
9.19W / 10.02W | 9.19W / 10.02W |
| Command Queuing: | Native Command Queuing | Native Command Queuing |
| Warranty: | 5 Year - Retail or OEM | 5 Year - Retail or OEM |
The Western Digital WD740ADFD drive we are reviewing today will be compared directly against the WD1500ADFD and WD740GD-00FLC0 drive in our limited benchmark test suite. We have also included the results of drives from our previous articles and will provide additional reviews of drives up to 500GB capacity ranges in the near future. The Western Digital Raptor drives ship with a five year warranty.
Hardware Setup
| Storage Test Bed Playback of iPeak Trace Files and Test Application Results |
|
| Processor: | AMD Opteron 170 (2.0GHz 2x1MB) |
| RAM: | 2 x 1GB Corsair 3500LL PRO Settings - DDR400 at (2.5-3-3-7 1T) |
| OS Hard Drive: | 1 x Maxtor MaXLine III 7L300S0 300GB 7200 RPM SATA 16MB |
| System Platform Drivers: | NVIDIA Platform Driver - 6.85 |
| Video Card: | 1 x Asus 7600GS (PCI Express) |
| Video Drivers: | NVIDIA nForce 84.21 WHQL |
| Optical Drive: | BenQ DW1640 |
| Cooling: | Zalman CNPS9500 |
| Power Supply: | OCZ GameXStream 700W |
| Case: | Gigabyte 3D Aurora |
| Operating System: | Windows XP Professional SP2 |
| Motherboard: | MSI K8N Diamond Plus |
Our current test bed reflects changes in the marketplace over the past six months. Based upon the continuing proliferation of dual core processors and future roadmaps from AMD and Intel signifying the end of the single core processor on the desktop in the near future, we settled on an AMD Opteron 170. This change will also allow us to expand our real world multitasking benchmarks in the near future while providing a stable platform for the next six months. We are currently conducting preliminary benchmark testing under Vista with both 2GB and 4GB memory configurations. We will switch to Vista once the driver situation matures and our benchmark results are repeatable.
Test Setup - Software
With the variety of disk drive benchmarks available, we needed a means of comparing the true performance of the hard drives in real world applications. While we will continue to utilize HDTach and PCMark05 for comparative benchmarks our logical choice for application benchmarking is the Intel iPeak Storage Performance Toolkit version 3. We originally started using this storage benchmark application in our Q2 2004 Desktop Hard Drive Comparison. The iPeak test can be designed to measure "pure" hard disk performance, and in this case we kept the host adapter consistent while varying the hard drive models. The idea is to measure the performance of individual hard drives with a consistent host adapter.
We utilize the iPeak WinTrace32 program to record precise I/O operations when running real world benchmarks. We then utilize the iPeak AnalyzeTrace program to review the disk trace file for integrity and ensure our trace files have properly captured the activities we required. Intel's RankDisk utility is used to play back the workload of all I/O operations that took place during the recording. RankDisk generates results in a mean service time in milliseconds format; in other words, it gives the average time that each drive took to fulfill each I/O operation. In order to make the data more understandable, we report the scores as an average number of I/O operations per second so that higher scores translate into better performance in all of our iPeak results. While these measurements will provide a score representing "pure" hard drive performance, the actual impact on the real world applications can and will be different.
Each drive is formatted before each test run and three tests are completed in order to ensure consistency in the benchmark results. The high and low scores are removed with the remaining median score representing our reported result. We utilize the NVIDIA nF4 SATA ports along with the NVIDIA IDE-SW driver to ensure consistency in our playback results when utilizing NCQ, TCQ, or RAID settings. Although we test NCQ capabilities, all of our reported results are generated with NCQ off unless otherwise noted.
Our iPeak tests represent a fairly extensive cross section of applications and usage patterns for both the general and enthusiast user. We will continually tailor these benchmarks with an eye towards the drive's intended usage and feature set when compared to similar drives. In essence, although we will reports results from our test suite for all drives, it is important to realize a drive designed for PVR duty will generate significantly different scores in our gaming benchmarks than a drive designed with gaming in mind such as the WD Raptor. This does not necessarily make the PVR drive a bad choice for those who capture and manipulate video while also gaming. Hopefully our comments in the results sections will offer proper guidance for making a purchasing decision in these situations. Our iPeak Test Suite consists of the following benchmarks.
VeriTest Business Winstone 2004: trace file of the entire test suite that includes applications such as Microsoft Office XP, WinZip 8.1, and Norton Antivirus 2003.
VeriTest Multimedia Content Creation 2004: trace file of the entire test suite that includes applications such as Adobe Photoshop 7.01, Macromedia Director MX 9.0, Microsoft Windows Media Encoder 9.0, Newtek Lightwave 3D 7.5b, and others.
AVG Antivirus 7.1.392: trace file of a complete antivirus scan on our test bed hard drive.
Microsoft Disk Defragmenter: trace file of the complete defragmentation process after the operating system and all applications were installed on our test bed hard drive.
WinRAR 3.51: trace file of creating a single compressed file consisting of 444 files in 10 different folders totaling 602MB. The test is split into the time it takes to compress the files and the time it takes to decompress the files.
File Transfer: individual trace files of transferring the Office Space DVD files to our source drive and transferring the files back to our test drive. The content being transferred consists of 29 files with a content size of 7.55GB.
AnyDVD 5.9.6: trace file of the time it takes to "rip" the Office Space DVD. We first copy the entire DVD over to our source drives, defragment the drive, and then measure the time it takes for AnyDVD to "rip" the contents to our test drive. While this is not ideal, it does remove the optical drive as a potential bottleneck during the extraction process and allows us to track the write performance of the drive.
Nero Recode 2: trace file of the time it takes to shrink the entire Office Space DVD that was extracted in the AnyDVD process into a single 4.5GB DVD image.
Game Installation: individual trace files of the time it takes to install Sims 2 and Battlefield 2. We copy each DVD to our secondary test drives, defragment the drive, and then install each game to our source drive.
Game Play: individual trace files that capture the startup and about 15 minutes of game play in each game. The Sims 2 trace file consists of the time it takes to select a pre-configured character, setup a university, downtown, business from each expansion pack (pre-loaded), and then visit each section before returning home. Our final trace file utilizes Battlefield 2 and we play the Daqing Oilfield map in both single and multiplayer mode.
Theoretical Performance: HDTune
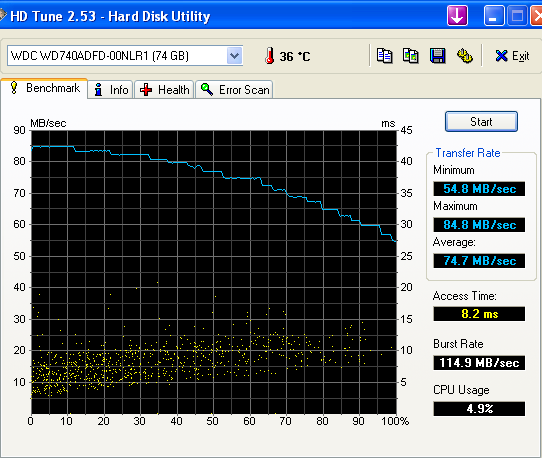
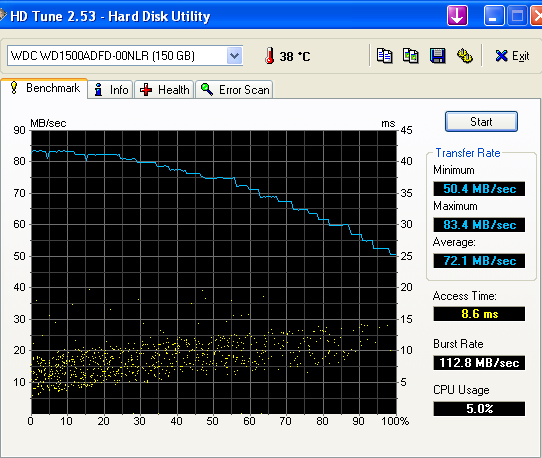
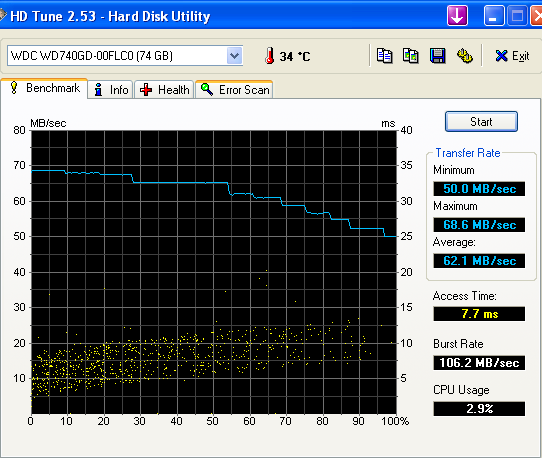
The Western Digital WD740ADFD has the highest overall sustained transfer rates of the three Raptor drives tested. The end test results are very similar to the WD1500ADFD and we attribute this to the single platter design, although we expected additional decay in the sustained transfer rates near the end of the test that did not occur. The WD740ADFD also bettered the WD1500ADFD in the random access, burst rate, and CPU utilization numbers.
The WD740GD actually had the best random access rates and CPU utilization numbers even with its limited buffer cache. However, this drive was not able to sustain the same average and maximum transfer rates due to the smaller cache, firmware, and older two platter design. Although the WD740ADFD drive has excellent sustained transfer and random access rates we will soon see this does not always translate into class leading performance.
Hard Drive Acoustics
Our acoustic test utilizes our standard test bed components but we implement AMD's Cool'n'Quiet technology and turn off the case fans to isolate as much case noise as possible during testing. Our OCZ power supply is nearly silent in these tests and our fanless ASUS 7600GS video card provides a further decrease in our case's ambient noise levels. Our drives are attached to the drive cage with rubber bushings to assist in isolating the noise of the drive without resulting harmonic changes due to the case design
Our acoustic tests are designed to measure the decibel levels while the system is at idle and also under load while running the General Hard Disk Drive Usage benchmark within PCMark 2005. We found through trail and error that this particular benchmark produces controlled readings across a wide range of applications within the benchmark. This particular benchmark utilizes 60% reads and 40% writes within the trace playback file.
The measurements are taken at a distance of 5 millimeters from the rear and front of the drive being tested in order to minimize surrounding environmental noise. We have noticed that unless we run a completely silent system in a silent room that measurements taken from 1 meter are generally not meaningful due to ambient noise levels. There are exceptions like the Raptor series of drives but overall most modern desktop drives are quieter now than the other components in the system.
The reported measurements are based on an A-weighted decibel score that measures frequencies similar to the way the human ear responds to sound. We take a total of three measurements for each test. We then subtract the high and low scores and arrive at our findings by reporting the remaining score.
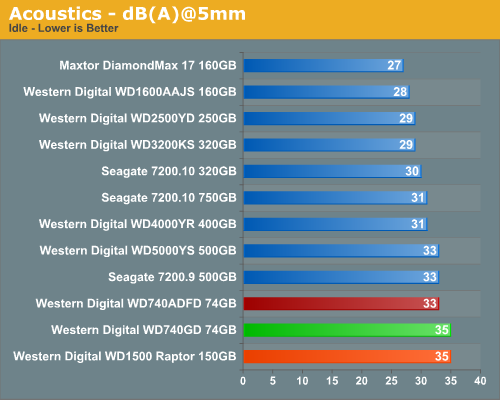
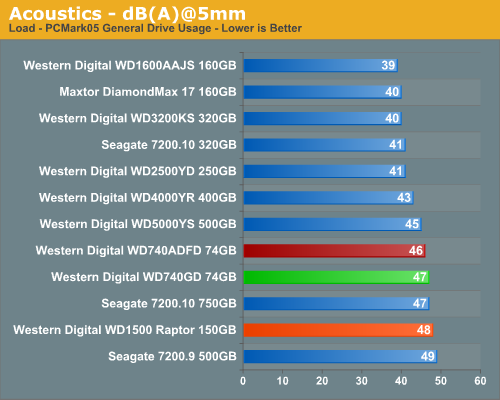
Our Western Digital WD740ADFD is quieter than the other Raptors in our objective testing, but we thought the results would be even better after listening to the drive during testing. Our subjective opinion is that the seek requests on the WD740ADFD are muted a great deal when compared to the other two Raptors. In fact the difference was notable to us although it did not show up completely in our objective tests. Our base dB(A) level in the room at time of testing was 24 dB(A).
Hard Drive Thermals
Our thermal tests utilize sensor readings via the S.M.A.R.T. (Self-Monitoring, Analysis and Reporting Technology) capability of the drives and are reported by utilizing the Active SMART 2.42 utility. We test our drives in an enclosed case environment without the front fan operational to simulate temperatures that could conceivably be reached in a SFF or HTPC case design. We typically find the reported numbers drop anywhere from 18% to 25% on average when the front fan is operational.
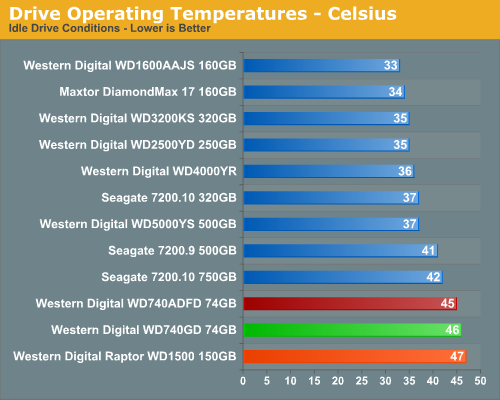
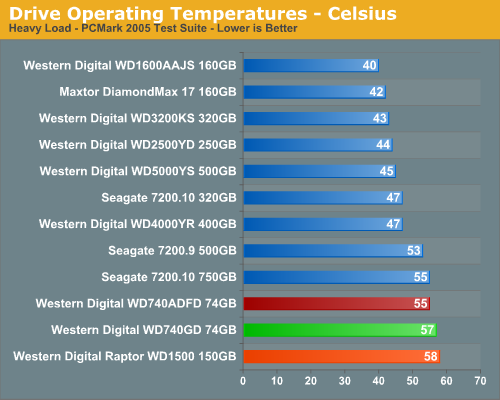
We expected the WD740ADFD to run slightly cooler than either the WD1500ADFD or WD740GD drives due to the single platter design and it did. However, all three of the Raptors still run hotter than the other drives in our tests with the exception of the Seagate 7200.10 750GB drive that ties our test unit in the heavy load results. We highly recommend a fan be installed near the Raptor drives during normal operation.
PCMark05 Performance
We are utilizing the HDD test suite within PCMark05 for further comparative hard disk scores as it provides a mixture of actual application results and specific read/write percentages utilized within these programs. It is also a readily available benchmark that others can use for comparative purposes. The program utilizes the RankDisk application within the Intel iPeak SPT suite of tools to record a trace of disk activity during usage of real world applications. These traces are then replayed to generate performance measurements based upon the actual disk operations within each application. The HDD test suite contains 53% read and 47% write operations with each trace section utilizing varied amounts of read or write operations. Additional information about the test suite can be found in PDF format here PCMark05 whitepaper.
The PCMark05 test results are based upon the following trace runs:
Windows XP Startup: This test consists of 90% reading and 10% writes that tracks XP activities at start-up.
Application Loading: This test consists of 83% reading and 17% writes that tracks the opening and closing of the following programs.
- Microsoft Word
- Adobe Acrobat Reader
- Windows Media Player
- 3Dmark 2001SE
- Leadtek WinFast DVD
- Mozilla Internet Browser
- Opening a Microsoft Word document, performing grammar check, saving and closing
- Compression and decompression using WinZip
- Encrypting and decrypting a file using PowerCrypt
- Scanning files for viruses using F-Secure Antivirus
- Playing an MP3 file with Winamp
- Playing a WAV file with Winamp
- Playing a DivX video using the DivX codec and Windows Media Player
- Playing a WMV video file using Windows Media Player
- Viewing pictures using Windows Picture Viewer
- Browsing the Internet using Microsoft Internet Explorer
- Loading, playing and exiting a game with Tom Clancy's Ghost Recon
File Write: This test consists of 100% write activities by writing 680MB of files onto the hard disk.
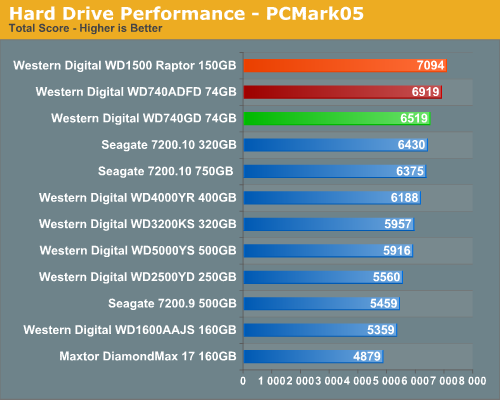
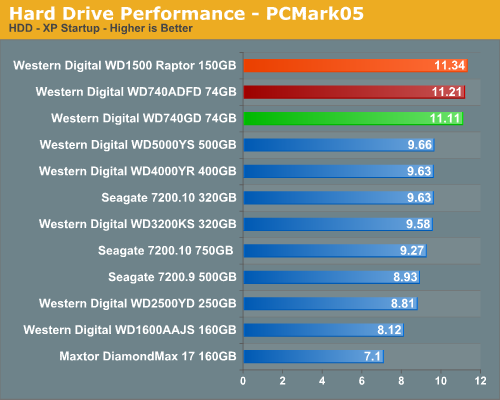
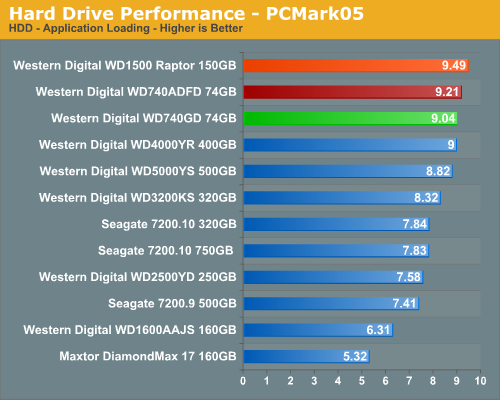
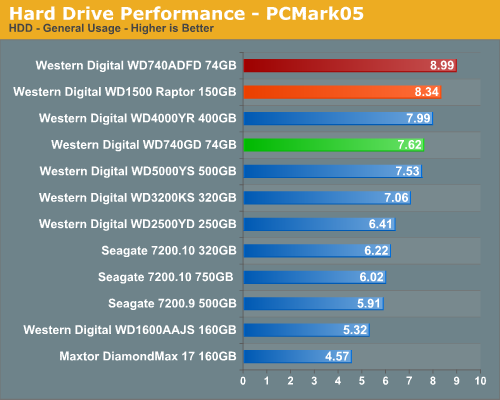
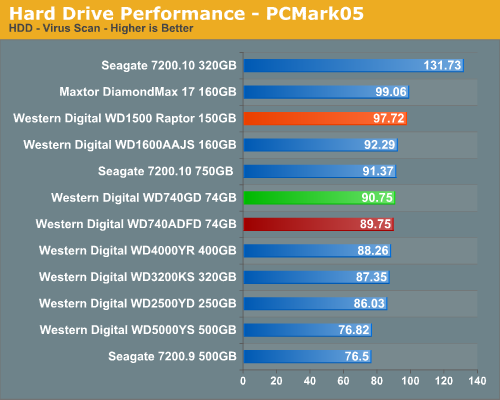
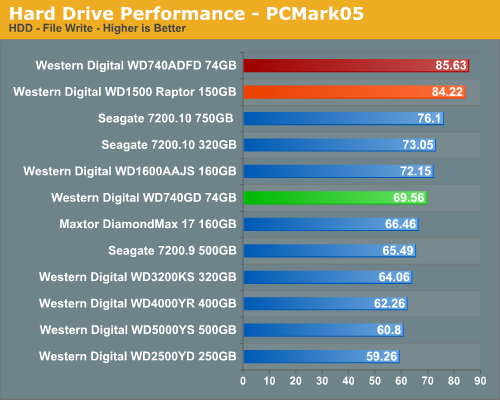
Our PCMark05 numbers follow a familiar test pattern with the WD Raptor series having a significant advantage over the drives in our tests. The performance delta between the two 74GB drives is 6% with the major differences occurring in the General Usage and File Write sections of the test where writes are a very important part of the test. Our WD740ADFD has excellent write speeds and surpasses the WD1500ADFD in these particular write heavy tests while just trailing it in the read intensive tasks.
iPeak Business Application Tests
Our iPeak Winstone benchmarks offer a glimpse into how well our hard disk drives will handle general office applications, media encoding, and graphics manipulation. While the business applications that are being tested tend to be more CPU bound at times, the performance of the hard drive can and will make a difference in the more disk intensive video and graphics applications where large media files are typically being edited.
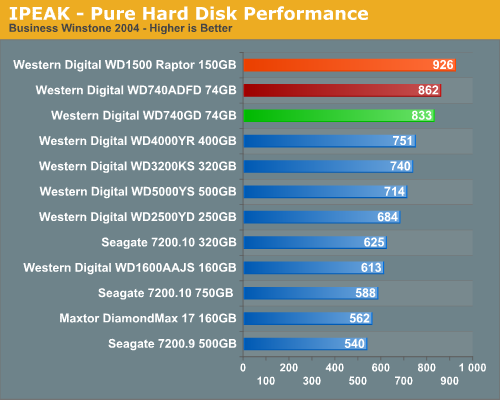
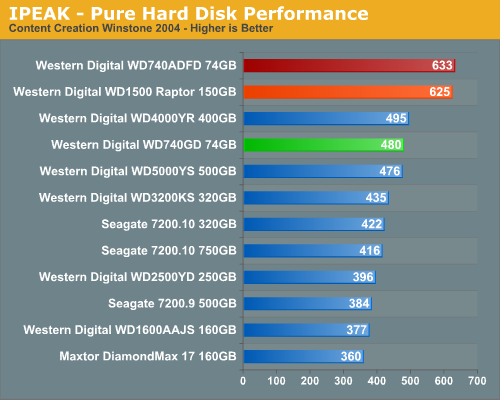
As expected the WD Raptor drives finish at the top in our business application tests as their 10k RPM spindle speed and optimized cache play an important role in their ability to sustain high transfer rates, especially in the Content Creation benchmark where transfer block sizes are significantly larger and more random than in the Business application benchmark. We see our WD74ADFD finishing ahead of the WD1500ADFD in the Content Creation benchmark where write operations account for a large portion of the test and just barely trailing in the Business Winstone test that emphasizes small block sizes of data in non-sequential order.
iPeak General Task Tests
The iPeak based General Task benchmarks are designed to replicate utility based application tasks that typically are disk intensive and represent common programs utilized on the majority of personal computers. While the WinRAR program is very CPU intensive it will typically stress the storage system in short bursts. Our antivirus benchmark will stress the storage system with continual reads and sporadic write requests while the defragmentation process is split between continual read and write requests.
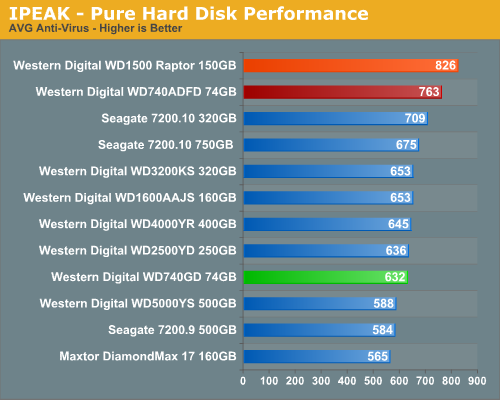
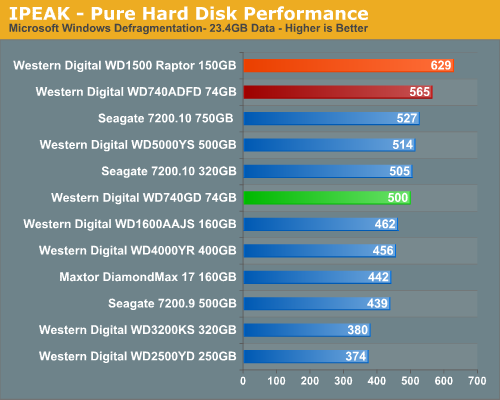
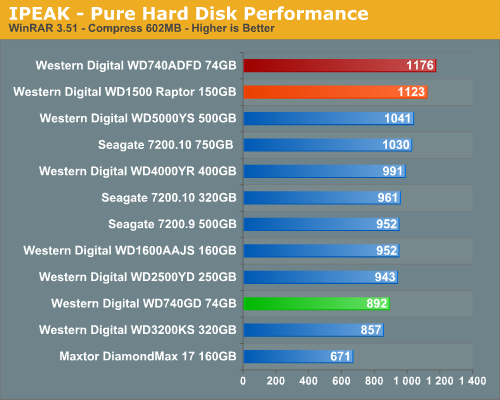
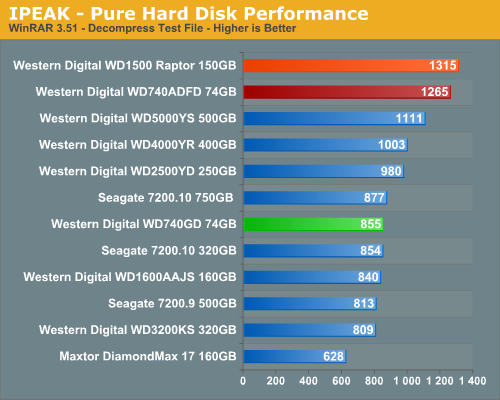
The WD740ADFD slightly trails the WD1500ADFD in our AVG and Defragmentation tests with results that mirror the PCMark 2005 testing. The WD1500ADFD performs better in tests slanted towards read operations while the WD740ADFD performs as well or better in write operations due to slightly better sustained transfer rates. Our WD740GD is unable to keep up with the other Raptor drives - or for that matter several of our other drives that contain the larger 16MB cache sizes. This is especially true in the WinRAR tests where large cache sizes are very advantageous for improved performance.
iPeak Video/Audio Tests
The iPeak based Video/Audio benchmarks are designed around simulating media encoding and HTPC activities. These are basic benchmarks at this time as this section will be expanded once we start testing under Vista. Our change to a dual core processor will assist us in maintaining a balance between the CPU and Storage systems during the trace file creation and benchmarking processes. These benchmarks are CPU intensive in nature but also require a balanced storage system with the ability to handle read and write requests simultaneously in a very efficient manner.
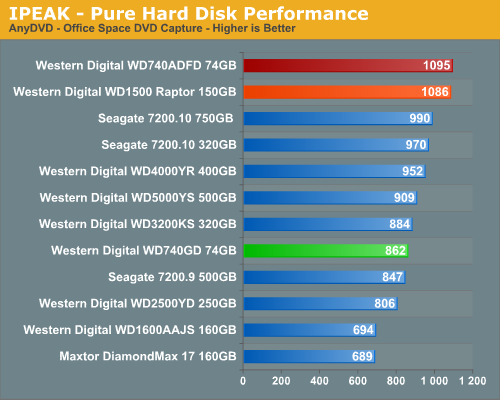
The AnyDVD benchmark is heavily weighted to write requests with the results showing a common pattern with the two 16MB cache Raptors finishing first and second and the WD740ADFD once again showing its strength in the write intensive benchmarks. However, we found the WD740GD was constantly pausing during writes due to the smaller cache size, and we witnessed buffer overruns on the large file sizes included in this test. Even with the pauses, its superior transfer rates still kept the drive ahead of the other 8MB cache drives in this benchmark.
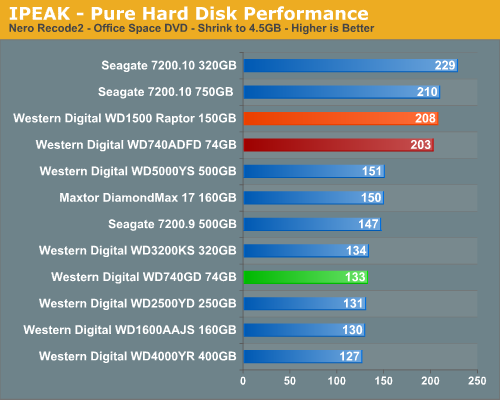
The Nero Recode 2 benchmark is weighted to streaming read requests but is balanced by continuous write operations near the end of the test. This benchmark is one of the most demanding ones in our test suite with the disk being active the entire trace file with several 100% utilization peaks. The two 16MB cache Raptors finish near the top with the WD740GD 8MB cache drive placing near the bottom. Upon reviewing the trace file results it was obvious that the WD740GD was hampered by its smaller cache and lower sustained transfer rates as it had a significant number of buffer overruns during testing.
iPeak Game Installation Tests
Our iPeak based Game Installation benchmarks simply show the ability of the hard drive to write data as quickly as possible to the disc based upon the installation software instructions. As detailed in our iPeak setup description we installed the games from our source drive in order to eliminate the optical drive bottleneck. In separate application timing we witnessed basically the same percentage spread when installing the games via our DVD drive so these results are representative of actual installation performance.
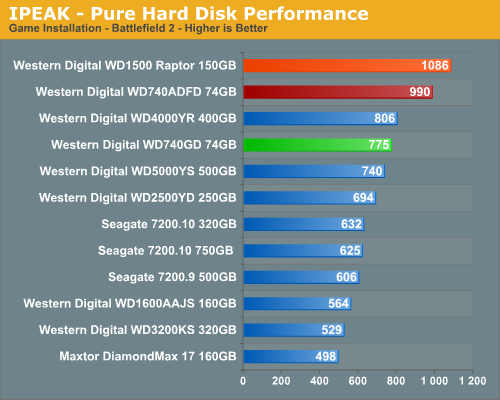
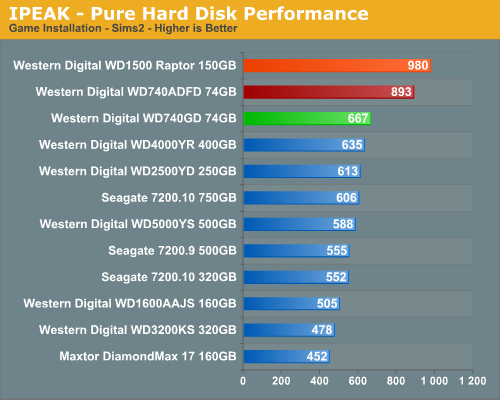
The Raptors once again finish at or near the top in our gaming tests although we expected the WD740ADFD to finish closer to the WD1500ADFD due to the amount of write operations involved in the game installations. A review of the trace files did not indicate any real standout issues with the 74GB drive, although we noticed several minor dips when the drive was reading information off the source drive. This did not occur with the 150GB Raptor.
We need to remember these tests reflect pure hard drive performance and will be mitigated by the overall system platform as we will see in our application tests. These tests are basically designed around continual read/write requests that favor large cache sizes, properly tuned firmware, and high sustained transfer rates.
iPeak Game Play Tests
The iPeak based Game Play tests are centered on the benefits of having a hard disk that can load non-linear or sequential data files quickly without interrupting the flow of the game.
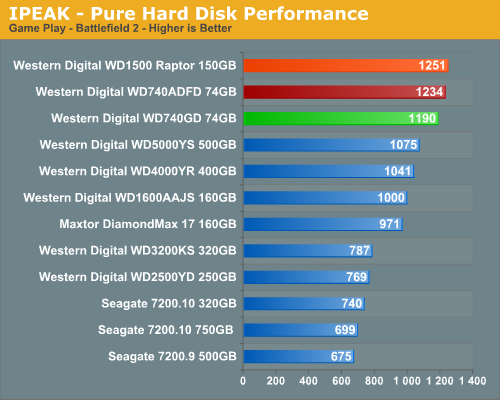
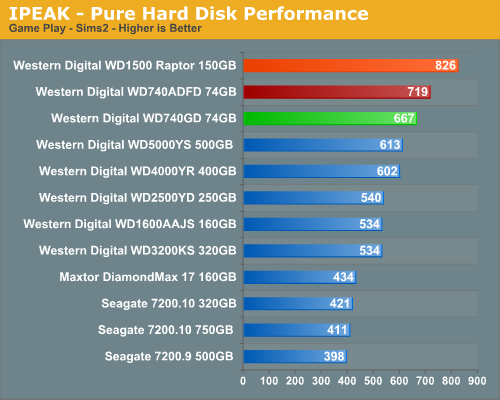
When it comes to gaming the Raptors rule. All three Raptors place in the top three spots with the two 16MB cache versions finishing one and two once again. Although we are looking at pure performance results, in subjective testing the Raptor family of drives could always be identified when loading or playing a game. Although the capacities of the drives are small, if you want the best overall gaming performance in a drive with a SATA interface then your only choice are the Raptors.
Actual Application Performance
Our application benchmarks are designed to show application performance results with times being reported in minutes / seconds or seconds only, with lower scores being better. While these tests will show some differences between the drives it is important to understand we are no longer measuring the pure performance of the hard drive but how well our platform performs with each individual drive. The performance of a hard drive is an integral part of the computer platform but other factors such as memory, CPU, core logic, and even driver choice can play a major role in determining how well the hard drive performs in any given task. Also worth noting is that new features of Windows Vista - specifically SuperFetch - can further reduce the measured performance differences between hard drives.
Game Load Test
Our Sims 2 - Open for Business test measures the time it takes to load the initial portion of the game. Our application timer starts when the game icon is initiated until the neighborhood menu appears.
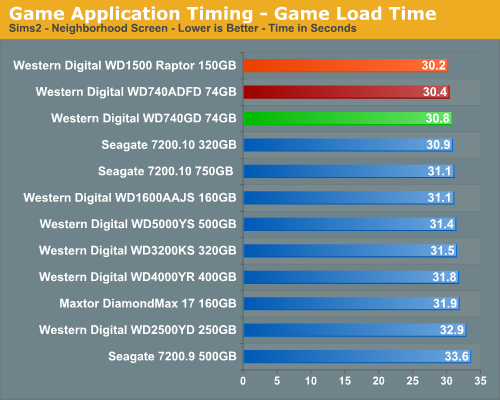
The results are basically the same as our iPeak results as the WD Raptor series continues to lead all drives, but the performance differences are not as drastic once we take into account the entire platform. The times might not show that great of a difference but over the course of game play we could always identify the system with a Raptor in it. Of course, our ears generally knew first but we could tell the differences in game startups and level loads with a Raptor equipped drive.
Game Level Load
This test centers on the actual loading of a playable level within our game selections. We run Battlefield 2 and measure the time it takes to load the Daqing Oilfields level. Our application timer begins when the start single player icon is initiated and ends when the join game icon is visible.
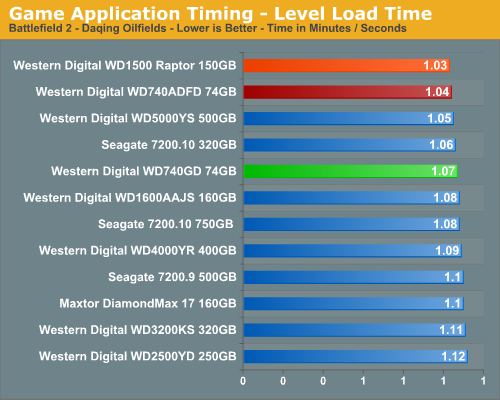
The WD1500ADFD Raptor continues its pattern of being the best available drive for the gaming enthusiast and our subjective opinion also matches the test scores. Of course, the difference in load times between the Raptor and the WD2500YD drive was only nine seconds but it seemed like an eternity as we repeated the tests for each drive. The WD740ADFD finishes right behind the WD1500ADFD once again proving that the improved firmware, increased cache size, and single platter design allows it to keep up with the 150GB drive.
AnyDVD 5.9.6
Our next test has us utilizing the "ripping" function of AnyDVD to copy the Office Space DVD file from our source drive to our test drive. Our DVD features 29 files totaling 7.55GB of data and is an excellent test for determining the write speed of a drive.
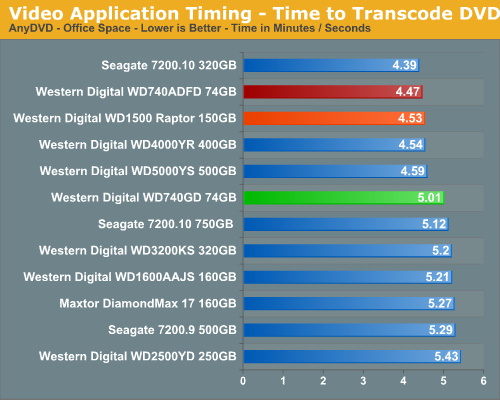
Our Seagate Barracuda 7200.10 320GB drive scores extremely well in this test. The WD740ADFD also finishes ahead of the WD1500ADFD in this test where write speeds are extremely critical for the performance of the drive.
Nero Audio Encode
Our last test has us utilizing the audio encoding functions of Nero to convert our INXS Greatest Hits audio files in MP4 format to a high quality variable rate MP3 file for our portable player. Our test features 16 files totaling 137MB of data and is an excellent test for determining the read and write speed of a drive.
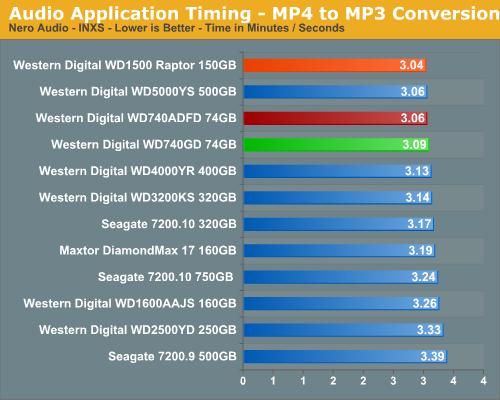
The test results show once again the amount of time a fast hard drive like the WD Raptor can save over the course of audio or video file manipulation session. In this case, the WD1500ADFD finishes just ahead of the 74MB Raptors where it handles small block sizes in sequential order slightly better.
Quick Take
Our experiences to date with the Western Digital WD740ADFD have been terrific. The recent updates to the drive have brought it into the same performance sector as the larger WD1500ADFD drive. We found the overall write performance and sustained transfer rates to be excellent and class leading in our test results. The drive even has improved thermal and acoustic characteristics over the other Raptors, although it's certainly not competitive with other drives. Of course those drives do not have to contend with 10,000 RPM spindle speeds and firmware that is generally designed to extract the greatest amount of performance.
The WD740ADFD is not without faults. The obvious issue for most users is the capacity of the drive. Considering the rampant increase in storage requirements for games, operating systems, and video/audio needs, 74GB can start feeling cramped in a hurry. The other issue is price. The drive is currently selling for around $140 with rebate where the WD1500ADFD with twice the capacity can be had for $190 with rebate. In these terms, the 150GB Raptor is a much better buy. Even then, you are paying a large premium for performance, though the performance improvement is noticeable in both objective and subjective terms.
While the platter sizes have changed on the new 74GB Raptors, for the most part the story remains the same. The Western Digital Raptor drives still offer some of the best performance available (outside of SCSI and SAS). The high level of performance is somewhat offset by increased noise levels and operating temperatures, as well as the already noted higher prices and reduced capacities. In an ideal world, we would like to see some of the new 160GB platters used with a 10,000 RPM spindle speed, but there are technological hurdles involved with getting the drive heads to read and write data that fast. We expect to start seeing SCSI and SAS drives in the future that have platter sizes above 74GB, so hopefully Western Digital will be able to follow suit with newer Raptor models sporting higher areal densities and the accompanying increased capacities. Looking at the performance improvement Western Digital garnered by moving from a 37GB to a 74GB platter size in our benchmarks here, we can only dream about what we might see with 150GB platters.
We still have difficulty with recommending these drives to most people when excellent performing 500GB drives can be had for around $150 now, not to mention the well balanced smaller capacity models like the Seagate 320GB 7200.10 drive for $90. Many users will be hard-pressed to even notice the difference between most of the modern hard drives currently on the market. However, we are enthusiasts at heart, so in situations where money isn't a concern we would have a WD1500ADFD as the boot/OS drive with our favorite games installed on it, and we'd pair that with a top performing secondary 320GB~750GB drive for storage and other applications. Of course, if you are into benchmarking or have a specific application that benefits from it, then a pair of Raptors in RAID 0 will be even better. In the end, if you want one of the best performing drives in the market then you cannot go wrong with the 74GB or 150GB Raptor drives.


