Original Link: https://www.anandtech.com/show/2165
Western Digital WD1600AAJS: 160GB Served on Single Platter
by Gary Key on February 5, 2007 11:00 AM EST- Posted in
- Storage
Western Digital was founded in 1970 and began designing and manufacturing hard drives in 1988. The company is headquartered in Lake Forest, California, and employs approximately 23,000 people worldwide. Their innovative manufacturing facilities are located in Malaysia, California, and Thailand with research and design facilities in California.
The star of the show today is Western Digital's new 160GB per-platter technology currently being rolled out in their Caviar, SE, and SE16 drive families. While Western Digital announced this technology and started shipping the single platter drives back in July, multi-platter drives utilizing the new technology have just recently started shipping in volume to the retail channels. With this introduction, WD now joins Seagate, Maxtor, Samsung, and Hitachi in offering 160GB+ platter designs.
We will be reviewing additional drives from Hitachi and Samsung along with larger capacity drives from WD featuring the 160GB+ platter designs shortly, but today our focus is on the latest WD1600AAJS Caviar SE series product that features an 8MB drive buffer, native 3Gb/s SATA support, 160GB capacity, NCQ, and 7200 RPM spindle speeds. The SE series is available in capacities ranging from 40GB to 320GB and is considered to be Western Digital's mainstream desktop series with the SE16 series being slotted for the high performance desktop users with capacities up to 500GB.
The WD drives featuring the 160GB+ (we estimate actual platter size to be 167GB) per-platter technology can be identified by the introduction of an AA sequence after the drive designation and before the internal family identification number. As an example, the previous generation SE16 500GB drive was designated as the WD5000KS with the new 160GB+ per-platter design being identified as WD5000AAKS. At this time we expect WD to launch the AA series in the SE16 family at capacity points of 250GB, 320GB, 400GB, and 500GB. The SE AA series family will eventually have the same capacity points with the addition of the 160GB model we are reviewing today. The entry level Caviar AA series is scheduled at the same capacity points but we do not have confirmation if they will be available in retail or offered as OEM only drives.
The SE and SE16 AA series feature Automatic Acoustic Management (AAM) technology . The AAM feature allows the host user to select the acoustic level of the hard drive depending upon the controller utilized. The combination of AAM and Western Digital's advanced acoustic technologies, Whisperdrive and Softseek, generated some of the best acoustic results we have seen in testing to date.
Besides the new platter density, Western Digital is also introducing ramp load technology in the new drives. Ramp Load/Unload (LUL) technology is a proven design used in mobile devices that parks the recording head when the drive is idle and on spin up, maximizing available disk space and minimizing power usage, which usually results in lower transient acoustics, lower heat, and long-term drive reliability. Another added feature is that Native Command Queuing is now standard with the AA series drives, although as in previous reviews our initial testing we did not show any real benefits for the typical desktop user with this particular drive.
Let's see how well this drive performs and if 160GB per-platter technology makes a difference in the low-end market.
Feature Set: Western Digital Caviar SE 160GB
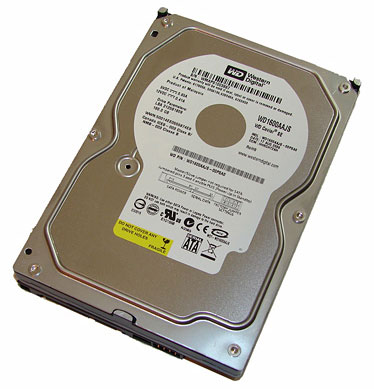
The external design of the Western Digital SE series is basically the same as other WD offerings but features the standard brushed aluminum faceplate instead of the familiar all black casing on the SE16 and RE2 drives. The drive is based on the industry standard 3.5" form factor platform with pertinent part number and warranty information embossed on a white sticker on the top of the casing.
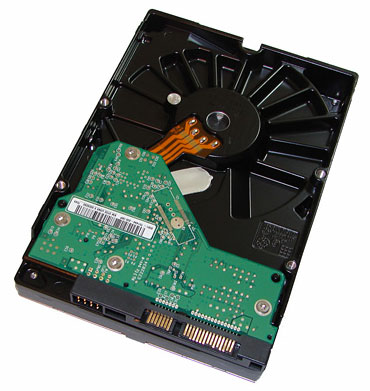
The new SE family ships with the Serial ATA data and power connectors but drops support for the 4-pin Molex power connector designed for use with older ATX power supplies. The reduced size PCB is openly visible on the bottom of the drive, and as in the previous WD drives the 8MB of cache memory and controller chips are located on the opposite side of the PCB.
To the left of the SATA data and power connectors is an eight-pin jumper block. This jumper block can be utilized to implement spread spectrum clocking or power up in standby operation. This drive ships with SATA 3Gbs operation enabled. While this feature was advantageous for burst transfer rates in our synthetic benchmarks, overall we did not see any measurable improvement in our real world benchmarks. Our test drive was manufactured in Malaysia.
Hard Disk Test Comparison and Features
| Specifications | ||
| Western Digital Caviar SE WD1600AAJS |
Maxtor DiamondMax 17 6G160E0 |
|
| Stated Capacity: | 160GB | 160GB |
| OS Capacity: | 149.05 GB | 149.05 GB |
| Interface: | SATA 3Gb/s | SATA 3Gb/s |
| Rotational Speed: | 7,200 RPM | 7,200 RPM |
| Cache Size: | 8 MB | 8 MB |
| Average Latency: | 4.20 ms (nominal) | 4.17 ms (nominal) |
| Read Seek Time: | 8.9 ms | 8.9 ms |
| Number of Heads: | 2 | 2 |
| Number of Platters: | 1 | 1 |
| Power Draw Idle / Load: |
8.75W / 9.5W | 7.9W / 10.0W |
| Command Queuing: | Native Command Queuing | Native Command Queuing |
| Warranty: | 1 Year - Retail Kit | 1 Year - Retail Kit |
The Western Digital WD1600AAJS drive we are reviewing today will be compared directly against the Maxtor DiamondMax 17 6G160E0 drive in our benchmark test suite. We have also included the results of drives from our previous articles and will provide additional reviews of drives in the 160GB to 500GB capacity ranges in the near future.
The Western Digital Caviar SE OEM drives ship with a three year warranty. Based upon reasons that are inexplicable Western Digital ships their retail SE kits with a one year warranty. The user can currently extend their warranty by two years through Western Digital for a cost of $14.95.
Test Setup - Hardware
| Standard Test Bed Playback of iPeak Trace Files and Test Application Results |
|
| Processor: | AMD Opteron 170 (2.0GHz 2x1MB L2) |
| RAM: | 2 x 1GB Corsair 3500LL PRO Settings - DDR-400 at (2.5-3-3-7, 1T) |
| OS Hard Drive: | 1 x Maxtor MaXLine III 7L300S0 300GB 7200 RPM SATA 16MB |
| System Platform Drivers: | NVIDIA Platform Driver - 6.85 |
| Video Card: | 1 x Asus 7600GS (PCI Express) for all tests |
| Video Drivers: | NVIDIA nForce 84.21 WHQL |
| Optical Drive: | BenQ DW1640 |
| Cooling: | Zalman CNPS9500 |
| Power Supply: | OCZ GameXStream 700W |
| Case: | Gigabyte 3D Aurora |
| Operating System: | Windows XP Professional SP2 |
| Motherboard: | MSI K8N Diamond Plus |
Our current test bed reflects changes in the marketplace over the past six months. Based upon the continuing proliferation of dual core processors and future roadmaps from AMD and Intel signifying the end of the single core processor on the desktop in the near future, we settled on an AMD Opteron 170. This change will also allow us to expand our real world multitasking benchmarks while providing a stable platform for the next six months. We are currently conducting preliminary benchmark testing under Vista with both 2GB and 4GB memory configurations. We will switch to Vista and possibly a new platform once the driver situation matures and our benchmark results are repeatable.
We debated on the memory size for our iPeak trace file creations and decided to move to 2GB of system memory. A system with a 1GB memory configuration is the predominant standard at this time, but 2GB memory setups are quickly becoming the new standard. Although a 1GB memory installation allows us to capture and report a higher amount of disk activity in certain applications, we decided the make the switch at this time as the difference is minimal when compared to the 1GB trace files.
Test Setup - Software
With the variety of disk drive benchmarks available, we needed a means of comparing the true performance of the hard drives in real world applications. While we will continue to utilize HDTach and PCMark05 for comparative benchmarks our logical choice for application benchmarking is the Intel IPEAK Storage Performance Toolkit version 3. We originally started using this storage benchmark application in our Q2 2004 Desktop Hard Drive Comparison. The iPeak test can be designed to measure "pure" hard disk performance, and in this case we kept the host adapter consistent while varying the hard drive models. The idea is to measure the performance of individual hard drives with a consistent host adapter.
We utilize the IPEAK WinTrace32 program to record precise I/O operations when running real world benchmarks. We then utilize the IPEAK AnalyzeTrace program to review the disk trace file for integrity and ensure our trace files have properly captured the activities we required. Intel's RankDisk utility is used to play back the workload of all I/O operations that took place during the recording. RankDisk generates results in a mean service time in milliseconds format; in other words, it gives the average time that each drive took to fulfill each I/O operation. In order to make the data more understandable, we report the scores as an average number of I/O operations per second so that higher scores translate into better performance in all of our iPeak results. While these measurements will provide a score representing "pure" hard drive performance, the actual impact on the real world applications can and will be different.
Each drive is formatted before each test run and three tests are completed in order to ensure consistency in the benchmark results. The high and low scores are removed with the remaining median score representing our reported result. We utilize the NVIDIA nF4 SATA ports along with the NVIDIA IDE-SW driver to ensure consistency in our playback results when utilizing NCQ, TCQ, or RAID settings. Although we test NCQ capabilities, all of our reported results are generated with NCQ off unless otherwise noted.
Our iPeak tests represent a fairly extensive cross section of applications and usage patterns for both the general and enthusiast user. We will continually tailor these benchmarks with an eye towards the drive's intended usage and feature set when compared to similar drives. In essence, although we will reports results from our test suite for all drives, it is important to realize a drive designed for PVR duty will generate significantly different scores in our gaming benchmarks than a drive designed with gaming in mind such as the WD Raptor. This does not necessarily make the PVR drive a bad choice for those who capture and manipulate video while also gaming. Hopefully our comments in the results sections will offer proper guidance for making a purchasing decision in these situations. Our iPeak Test Suite consists of the following benchmarks.
VeriTest Business Winstone 2004: trace file of the entire test suite that includes applications such as Microsoft Office XP, WinZip 8.1, and Norton Antivirus 2003.
VeriTest Multimedia Content Creation 2004: trace file of the entire test suite that includes applications such as Adobe Photoshop 7.01, Macromedia Director MX 9.0, Microsoft Windows Media Encoder 9.0, Newtek Lightwave 3D 7.5b, and others.
AVG Antivirus 7.1.392: trace file of a complete antivirus scan on our test bed hard drive.
Microsoft Disk Defragmenter: trace file of the complete defragmentation process after the operating system and all applications were installed on our test bed hard drive.
WinRAR 3.51: trace file of creating a single compressed file consisting of 444 files in 10 different folders totaling 602MB. The test is split into the time it takes to compress the files and the time it takes to decompress the files.
File Transfer: individual trace files of transferring the Office Space DVD files to our source drive and transferring the files back to our test drive. The content being transferred consists of 29 files with a content size of 7.55GB.
AnyDVD 5.9.6: trace file of the time it takes to "rip" the Office Space DVD. We first copy the entire DVD over to our source drives, defragment the drive, and then measure the time it takes for AnyDVD to "rip" the contents to our test drive. While this is not ideal, it does remove the optical drive as a potential bottleneck during the extraction process and allows us to track the write performance of the drive.
Nero Recode 2: trace file of the time it takes to shrink the entire Office Space DVD that was extracted in the AnyDVD process into a single 4.5GB DVD image.
Game Installation: individual trace files of the time it takes to install Sims 2 and Battlefield 2. We copy each DVD to our secondary test drives, defragment the drive, and then install each game to our source drive.
Game Play: individual trace files that capture the startup and about 15 minutes of game play in each game. The Sims 2 trace file consists of the time it takes to select a pre-configured character, setup a university, downtown, business from each expansion pack (pre-loaded), and then visit each section before returning home. Our final trace file utilizes Battlefield 2 and we play the Daqing Oilfield map in both single and multiplayer mode.
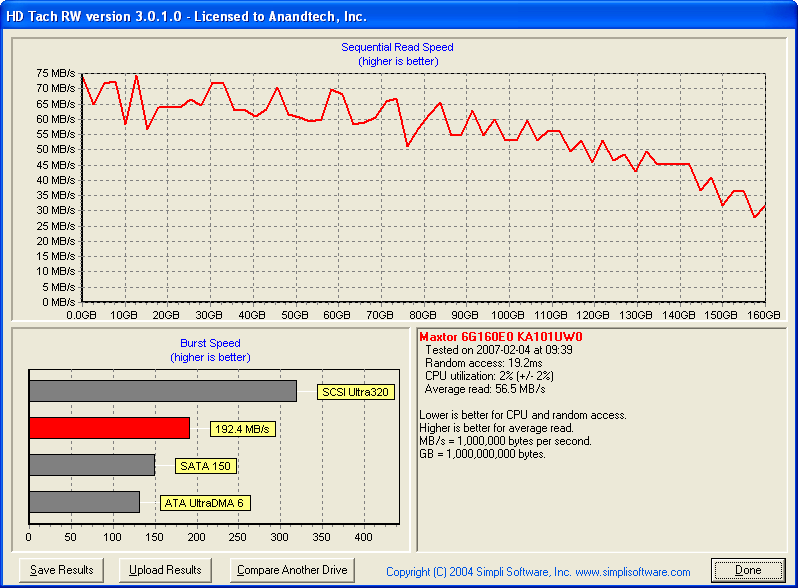
Hard Disk Performance: HDTach
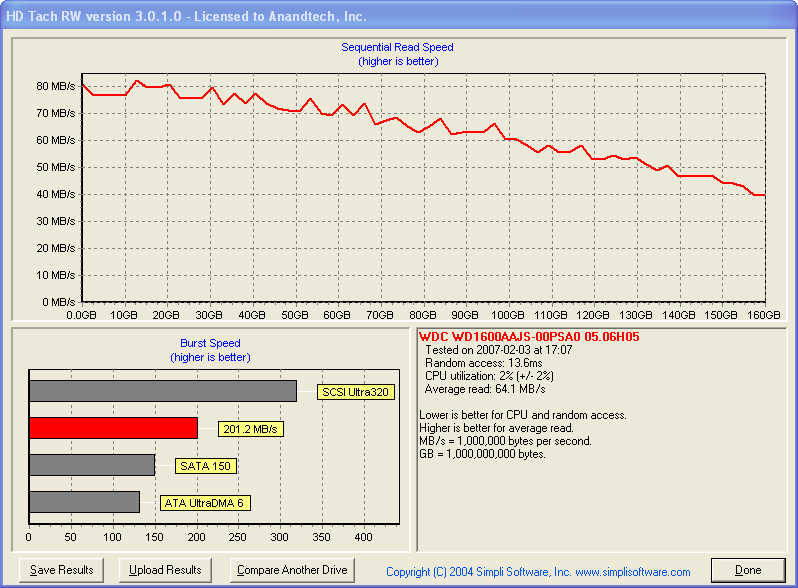 |
 |
| Click to enlarge |
We find HDTach to be useful for generating random access and average read rate results in a very consistent manner. Although the burst rates and CPU utilization numbers are interesting they tend to be meaningless in actual application performance comparisons.
The Western Digital Caviar SE 160GB has the highest average sequential read speed of 68.7MB/s with the Western Digital drive averaging 64.1MB/s in our direct comparison today. Our Maxtor DiamondMax 17 160GB drive trails at a still respectable 56.5MB/s. In previous testing our WD Raptor 150 led the field with a 75.4MB/s average, the Seagate 7200.10 750GB at 66.9MB/s, WD RE2 500GB drive at 62.4MB/s, WD RE2 400GB drive at 57.0MB/s, and the WD RE16 250GB drive at 51.4MB/s.
The random access time benchmark still favors the 10,000RPM spindle speed of the Raptor which generates a result of 8.6ms. The average rotational latency at 10,000 RPM is 3ms while the average rotational latency at 7200 RPM is 4.17ms; what this means is that the head seek speed on the Raptor is also significantly faster (~5.6ms) than the other drives (9.2-10.0ms). However, the Maxtor trails significantly in random access time posting a score of 19.2ms compared to 13.6ms on the WD drive. There appears to be a problem with the Maxtor unit in this particular test, as both drives advertise the same seek latency; we are still looking into the situation but expect this to have an impact on some of the results.
In our sequential read speed results the WD 160GB drive finishes around the 40MB/s mark at the end of the disk and the Maxtor at 31MB/s. In contrast, the WD Raptor finishes with a 52MB/s result that is more than 30% greater than the 7200 RPM drives. Although the WD 160GB drive has very good burst and random access rates we will soon see this does not always translate into class leading performance.
Hard Disk Performance: HD Tune
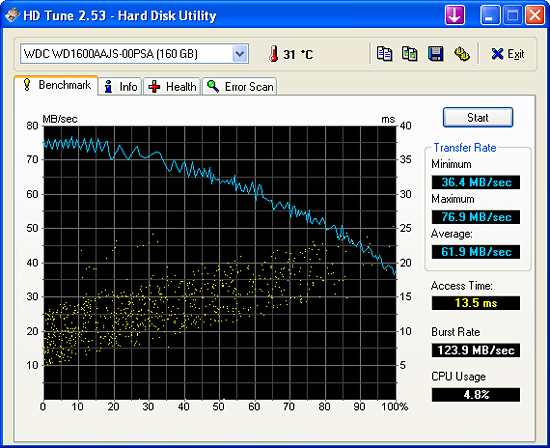
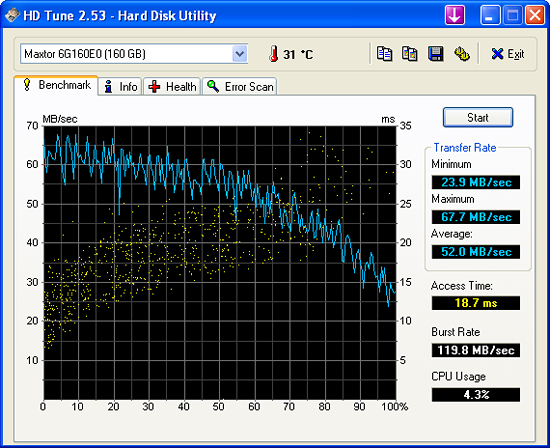
The HD Tune performance results between each drive mirror the HDTach results. The two programs each report slightly different results but the net result is that the WD drive provides better random access and sustained transfer rates than the Maxtor drive.
Hard Disk Performance: PCMark05
We are utilizing the HDD test suite within PCMark05 for further comparative hard disk scores as it provides a mixture of actual application results and specific read/write percentages utilized within these programs. It is also a readily available benchmark that others can use for comparative purposes. The program utilizes the RankDisk application within the Intel iPeak SPT suite of tools to record a trace of disk activity during usage of real world applications. These traces are then replayed to generate performance measurements based upon the actual disk operations within each application. The HDD test suite contains 53% read and 47% write operations with each trace section utilizing varied amounts of read or write operations. Additional information about the test suite can be found in PDF format here PCMark05 whitepaper.
The PCMark05 test results are based upon the following trace runs:
Windows XP Startup: This test consists of 90% reading and 10% writes that tracks XP activities at start-up.
Application Loading: This test consists of 83% reading and 17% writes that tracks the opening and closing of the following programs.
- Microsoft Word
- Adobe Acrobat Reader
- Windows Media Player
- 3Dmark 2001SE
- Leadtek WinFast DVD
- Mozilla Internet Browser
- Opening a Microsoft Word document, performing grammar check, saving and closing
- Compression and decompression using WinZip
- Encrypting and decrypting a file using PowerCrypt
- Scanning files for viruses using F-Secure Antivirus
- Playing an MP3 file with Winamp
- Playing a WAV file with Winamp
- Playing a DivX video using the DivX codec and Windows Media Player
- Playing a WMV video file using Windows Media Player
- Viewing pictures using Windows Picture Viewer
- Browsing the Internet using Microsoft Internet Explorer
- Loading, playing and exiting a game with Tom Clancy's Ghost Recon
File Write: This test consists of 100% write activities by writing 680MB of files onto the hard disk.
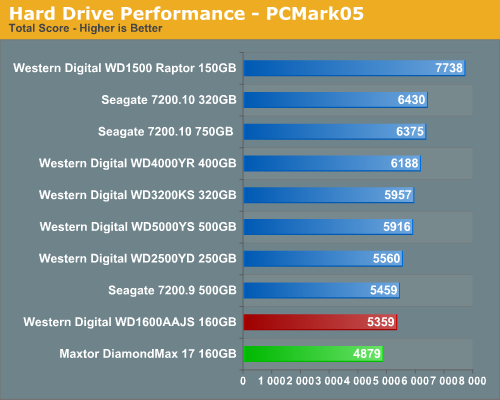
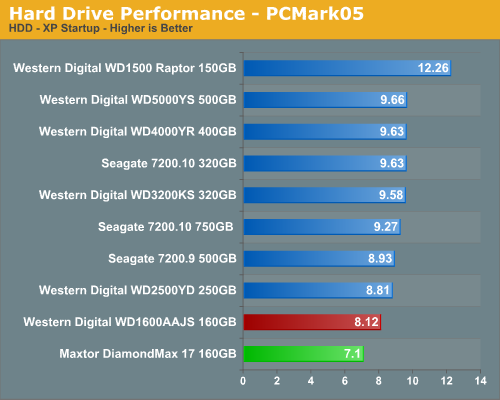
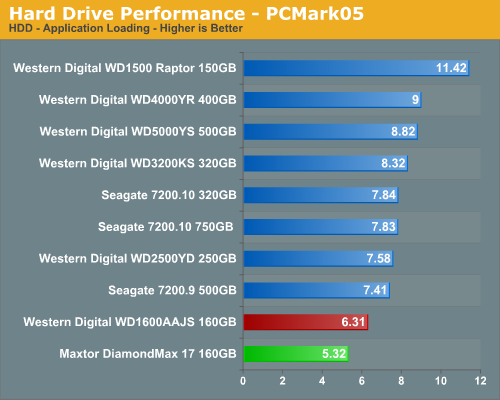
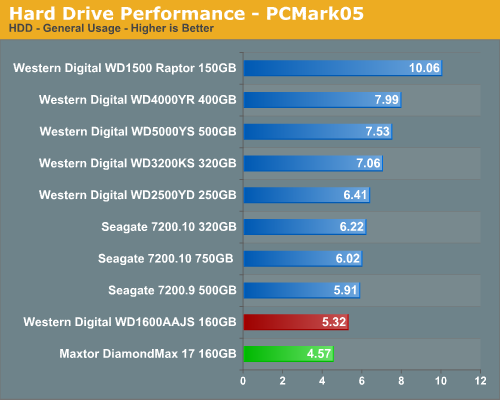
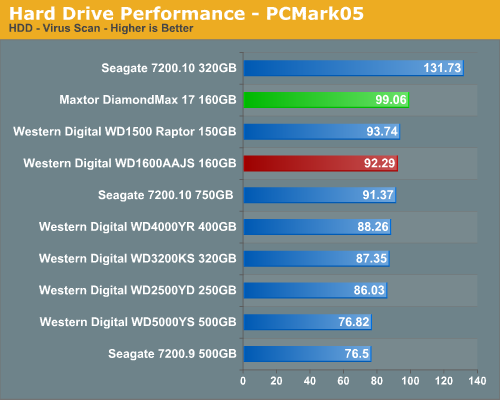
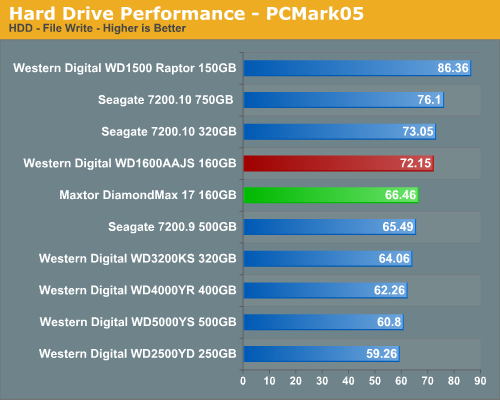
Our PCMark05 numbers follow a familiar test pattern with the WD Raptor having a significant advantage over the other drives in our tests. The performance delta between the two 160GB drives is 9%, although this is due to the results in all tests except the Virus Scanning where the Maxtor enjoys an advantage over all drives except the Seagate 320GB.
The general usage and application benchmarks that represent the majority of daily operations on a typical PC configuration clearly favor the Western Digital drive. Both of the 160GB drives are close throughout the first four tests and it is only when we get to the Virus Scanning section that we see the Maxtor drive hold a lead. We believe the short file sizes and very sequential nature of the test files in the virus scanning test favor the Maxtor 160GB drive.
Hard Disk Performance: iPeak Business Application Tests
Our iPeak Winstone benchmarks offer a glimpse into how well our hard disk drives will handle general office applications, media encoding, and graphics manipulation. While the business applications that are being tested tend to be more CPU bound at times, the performance of the hard drive can and will make a difference in the more disk intensive video and graphics applications where large media files are typically being edited.
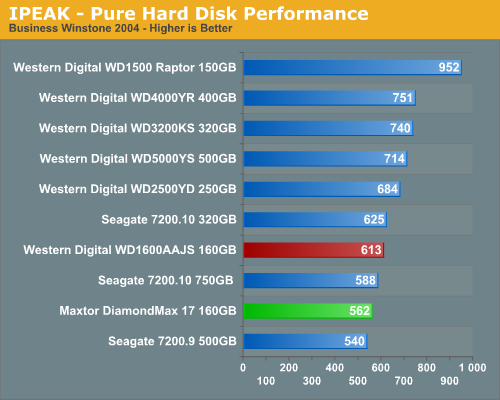
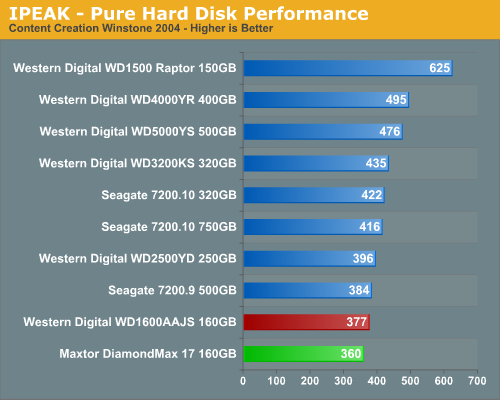
As expected the WD Raptor places first as its 10k RPM spindle speed and optimized cache play an important role in its ability to sustain high transfer rates, especially in the Content Creation benchmark where transfer block sizes are significantly larger than in the Business application benchmark.
Our two 160GB drives make a respectable showing in these benchmarks with the WD drive placing 9% ahead of the Maxtor in the Business Winstones and 5% in the Content Creation test. This continues the trend we noticed in the PCMark05 tests as the WD drive was generally faster in the general usage and application benchmarks. Although both drives scored near the bottom in each test we did not expect them to perform much better due to the 8MB cache and firmware designed for general desktop usage with importance being placed on acoustics and power usage.
Hard Disk Performance: iPeak General Task Tests
The iPeak based General Task benchmarks are designed to replicate utility based application tasks that typically are disk intensive and represent common programs utilized on the majority of personal computers. While the WinRAR program is very CPU intensive it will typically stress the storage system in short bursts. Our antivirus benchmark will stress the storage system with continual reads and sporadic write requests while the defragmentation process is split between continual read and write requests.
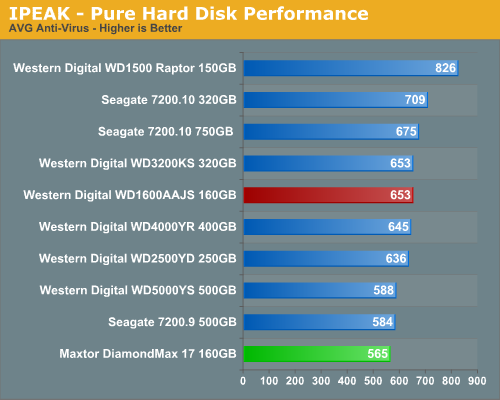
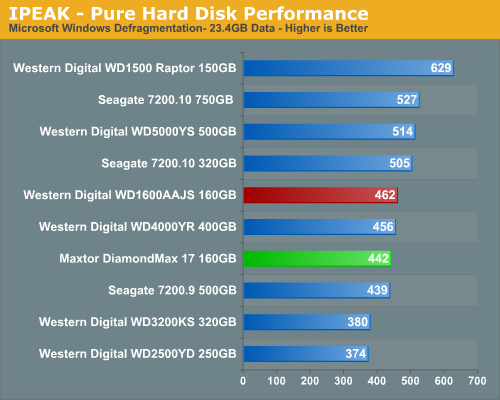
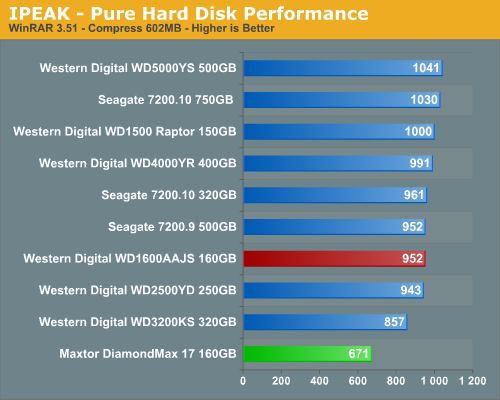
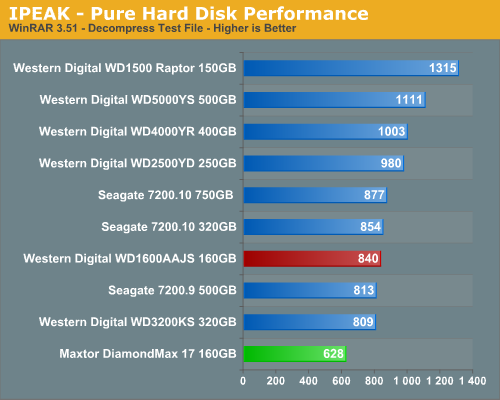
The Maxtor 160GB surprised us with terrible results in the compression and decompression tests with results that were up to 41% worse than the WD 160GB drive. We ran the tests several times with the same results and in our real world tests the differences were about the same. The Maxtor 160GB has issues working with large block sizes in a non-sequential order as our iPeak trace file results verified. We expected the same behavior with the WD drive since it is equipped with the same 8MB cache size but apparently Maxtor's firmware or caching scheme is not as efficient as Western Digital in this example. The WD 160GB drive scored decently in the Virus Scan and Defragmentation tests and placed ahead of the Maxtor drive which mirrors the PCMark 2005 results. Obviously, the slower-than-expected access times HDTach reported earlier are born out in actual testing; we can only hope that update firmware or some missed setting can improve the results, as right now the Maxtor is clearly inferior to the WD in a variety of applications.
Hard Disk Performance: iPeak File Transfer Tests
Our iPeak based File Transfer benchmarks indicate how well a drive performs in a strictly read or write operation with a limited number of files (29) but a large amount of data (7.55GB). The test is designed to ensure continual write or read operations across a large section of the drive that requires constant head and actuator movements along with caching large amounts of data.
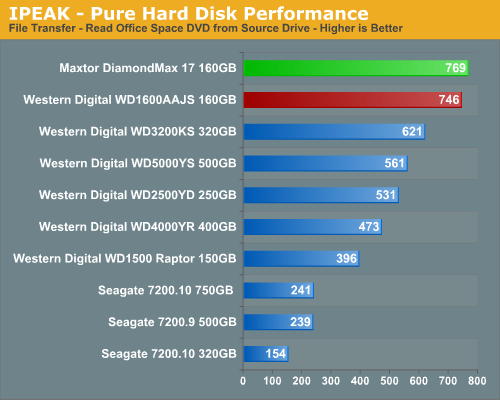
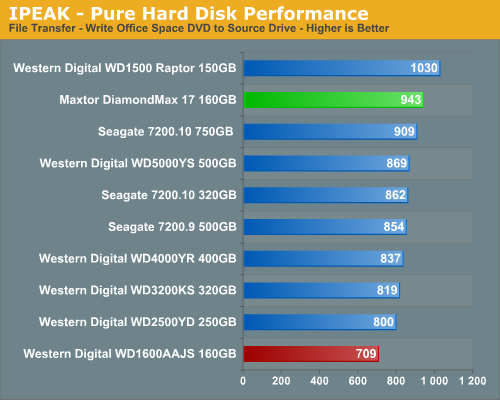
The read and write performance of the Maxtor 160GB is very impressive in these benchmarks and shows that the drive works extremely well with large block sizes in a regular pattern where it had issues with large blocks sizes in an irregular pattern. The WD 160GB read performance is also excellent but its write performance was below average. After further examination of the trace files we noticed the write section of the test consisted of several pauses where the drive's throughput would drop by 7% at random points. We feel like this is an indication of the smaller cache and optimization issues as the drive's performance with small block sizes in a sequential order is very good. Both drives are obviously helped in the read test by their higher areal densities, courtesy of the 160GB platter size.
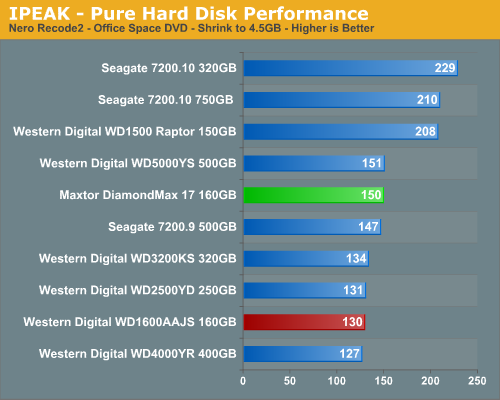
Hard Disk Performance: iPeak Video/Audio Tests
The iPeak based Video/Audio benchmarks are designed around simulating media encoding and HTPC activities. These are basic benchmarks at this time as this section will be expanded once we start testing under Vista. Our change to a dual core processor will assist us in maintaining a balance between the CPU and Storage systems during the trace file creation and benchmarking processes. These benchmarks are CPU intensive in nature but also require a balanced storage system with the ability to handle read and write requests simultaneously in a very efficient manner.
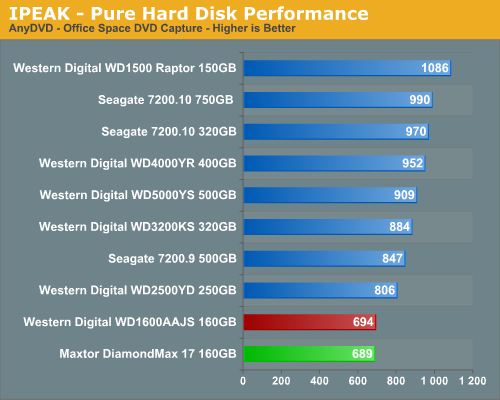
The AnyDVD benchmark is heavily weighted to write requests with the results showing a common pattern with the WD Raptor finishing first and the WD 160GB placing just ahead of the Maxtor drive. However, both drives finish well behind the group and we found after reviewing our trace file results that the drives were constantly pausing during writes. This is again due to the smaller cache sizes and other firmware optimizations, and we repeatedly witnessed buffer overruns on the large file sizes included in this test.
The Nero Recode 2 benchmark is weighted to streaming read requests but is balanced by continuous write operations. This benchmark is one of the most demanding ones in our test suite with the disk being active the entire trace file with several 100% utilization peaks. The Maxtor 160GB finishes just ahead of the WD drive due to its better write performance while both place in the middle of the pack.
Hard Disk Performance: iPeak Game Installation Tests
Our iPeak based Game Installation benchmarks simply show the ability of the hard drive to write data as quickly as possible to the disc based upon the installation software instructions. As detailed in our iPeak setup description we installed the games from our source drive in order to eliminate the optical drive bottleneck. In separate application timing we witnessed basically the same percentage spread when installing the games via our DVD drive so these results are representative of actual installation performance.
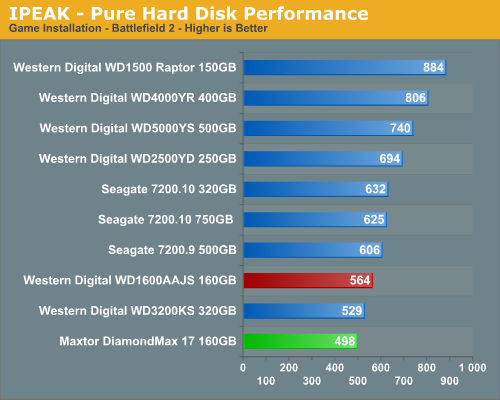
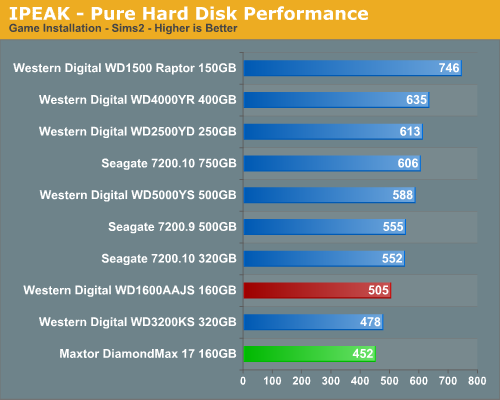
The WD 160GB drive once again finished ahead of the Maxtor 160GB in these tests with performance differences up to 13%, although both drives finish near the bottom in testing. We need to remember these tests reflect pure hard drive performance and will be mitigated by the overall system platform as we will see in our application tests. These tests are basically designed around continual requests that favor large cache sizes and properly tuned firmware.
Hard Disk Performance: iPeak Game Play Tests
The iPeak based Game Play tests are centered on the benefits of having a hard disk that can load non-linear or sequential data files quickly without interrupting the flow of the game.
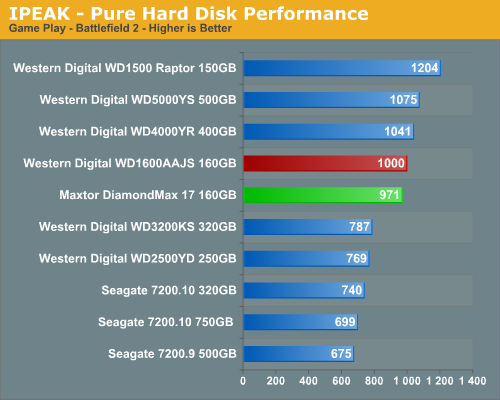
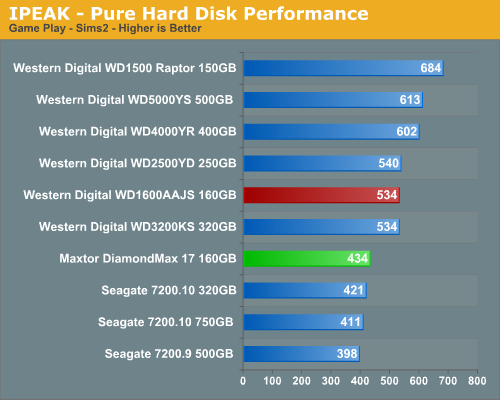
Like a good racehorse, the WD Raptor places first as its 10k RPM spindle speed and optimized cache play an important role in its ability to sustain high transfer rates. Both of our 160GB drives score well with the WD scoring up to 23% better than the Maxtor drive in the demanding Sims 2 game play test. While these differences sound large, in actual desktop usage most users will not be able to tell the difference except when utilizing the Raptor in certain situations. While these tests which certainly reflect what you would see during game play, the small files and non-sequential nature of the requests favor the Western Digital drives.
Actual Application Performance
Our application benchmarks are designed to show application performance results with times being reported in minutes / seconds or seconds only, with lower scores being better. While these tests will show some differences between the drives it is important to understand we are no longer measuring the pure performance of the hard drive but how well our platform performs with each individual drive. The performance of a hard drive is an integral part of the computer platform but other factors such as memory, CPU, core logic, and even driver choice can play a major role in determining how well the hard drive performs in any given task. Also worth noting is that new features of Windows Vista - specifically SuperFetch - can further reduce the measured performance differences between hard drives.
Game Load Tests
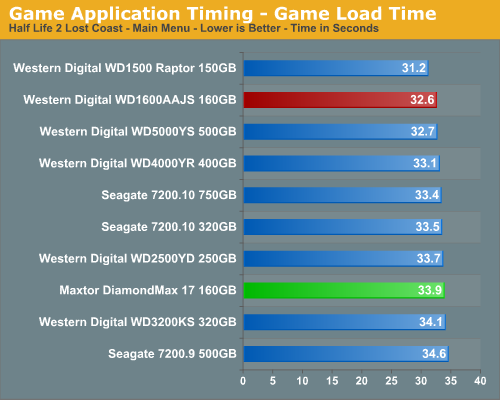
In our Half-Life 2: Lost Coast test we measure the time it takes to load the game with the application timer starting when the play game icon is initiated in the Steam menu until the main game menu appears. The results follow our overall iPeak game results with the Western Digital Raptor performing best, but it is only up to 10% better in this benchmark. The WD 160GB scores better than the Maxtor 160GB drive but the performance difference requires a benchmark to notice it and it is almost impossible to detect during actual game play.
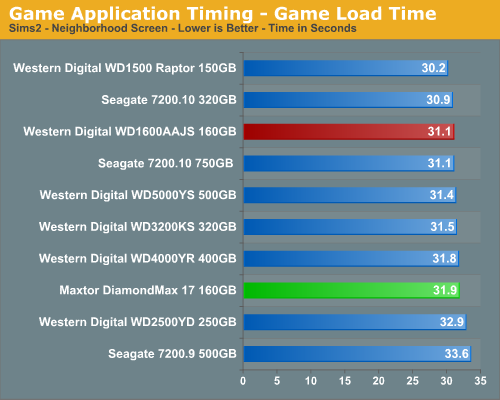
Our Sims 2 - Open for Business test measures the time it takes to load the initial portion of the game. Our application timer starts when the game icon is initiated until the neighborhood menu appears. The results are basically the same as our Half-Life 2 results as the WD Raptor continues to lead all drives, but we notice the WD 160GB finishing ahead of several other drives with the Maxtor drive near the bottom again.
Game Level Load
Our tests focus on the actual loading of a playable level within our game selections.
- The Sims 2 - Open for Business test measures the time it takes to load the Downtown sector of the game from Veronaville. Our application timer starts when the Downtown game icon is initiated and ends when the downtown graphics are visible.
- The Battlefield 2 test measures the time it takes to load the Daqing Oilfields level. Our application timer begins when the start single player icon is initiated and ends when the join game icon is visible.
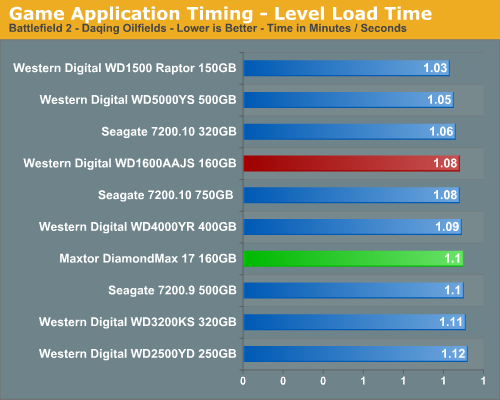
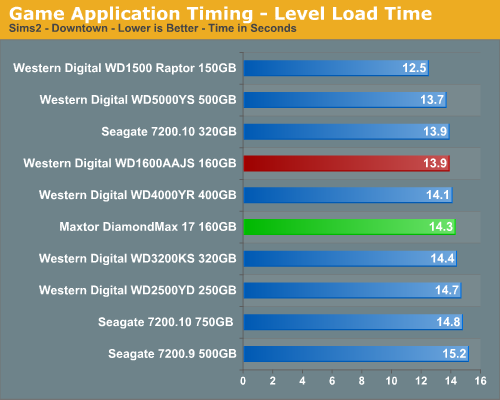
The WD Raptor continues its pattern of being the best available drive for the gaming enthusiast and our subjective opinion also matches the test scores. After working with all of the drives on an almost daily base we can still tell which machine has a Raptor in it. Our WD 160GB drive scores better than the Maxtor drive but both drives are so close in performance that it is difficult to distinguish one from another in these tests.
WinRAR 3.51
Our WinRAR tests measure the time it takes to compress/decompress our test folder that contains 444 files, 10 folders, and contains 602MB of data. This is same test folder utilized in our iPeak test suite. While the benchmark is extremely CPU intensive for the compression test it still requires a fast storage system to keep pace with the CPU.
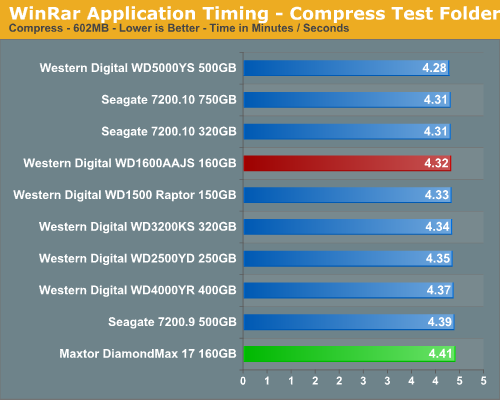
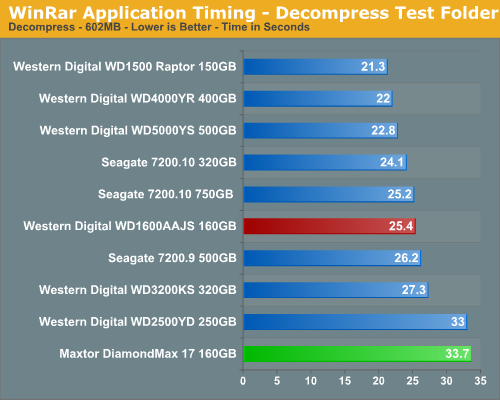
The compression tests mimic our iPeak results with the WD 160GB drive finishing ahead of the Maxtor 160GB but the difference in scores is not as drastic due to the platform components affecting the overall performance of the drives. However, these results further confirm the fact that the Maxtor drive has issues working with large block sizes in a non-sequential order.
AnyDVD 5.9.6
Our next test has us utilizing the "ripping" function of AnyDVD to copy the Office Space DVD file from our source drive to our test drive. Our DVD features 29 files totaling 7.55GB of data and is an excellent test for determining the write speed of a drive.
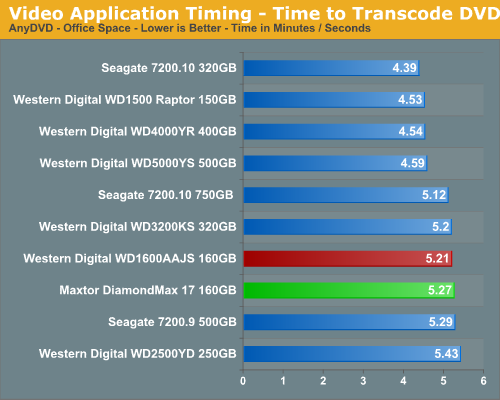
The test results show what we all know: speed kills but in this case the speed belongs to the Seagate Barracuda 7200.10 320GB drive and not the WD Raptor. The test scores from the two 160GB drives are similar to the iPeak results with the Maxtor just barely trailing the WD drive, but both drives finish in the middle of the pack.
Nero Audio Encode
Our last test has us utilizing the audio encoding functions of Nero to convert our INXS Greatest Hits audio files in MP4 format to a high quality variable bitrate MP3 file for our portable player. Our test features 16 files totaling 137MB of data and is an excellent test for determining the read and write speed of a drive.
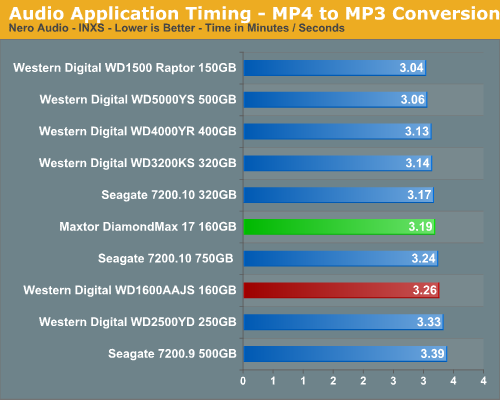
The test results show once again the amount of time a fast hard drive like the WD Raptor can save over the course of audio or video file manipulation session. In this case, the Maxtor 160GB drive finishes ahead of the WD 160GB drive and mirrors earlier results in tests where the Maxtor drive favors small block sizes in sequential order.
Hard Drive Performance: Acoustics
Our acoustic test utilizes our standard test bed components but we implement AMD's Cool'n'Quiet technology and turn off the case fans to isolate as much case noise as possible during testing. Our OCZ power supply is nearly silent in these tests and our fanless ASUS 7600GS video card provides a further decrease in our case's ambient noise levels. Our drives are attached to the drive cage with rubber bushings to assist in isolating the noise of the drive without resulting harmonic changes due to the case design
Our acoustic tests are designed to measure the decibel levels while the system is at idle and also under load while running the General Hard Disk Drive Usage benchmark within PCMark 2005. We found through trail and error that this particular benchmark produces controlled readings across a wide range of applications within the benchmark. This particular benchmark utilizes 60% reads and 40% writes within the trace playback file.
The measurements are taken at a distance of 5 millimeters from the rear and front of the drive being tested in order to minimize surrounding environmental noise. We have noticed that unless we run a completely silent system in a silent room that measurements taken from 1 meter are generally not meaningful due to ambient noise levels. There are exceptions like the Raptor series of drives but overall most modern desktop drives are quieter now than the other components in the system.
The reported measurements are based on an A-weighted decibel score that measures frequencies similar to the way the human ear responds to sound. We take a total of three measurements for each test. We then subtract the high and low scores and arrive at our findings by reporting the remaining score.
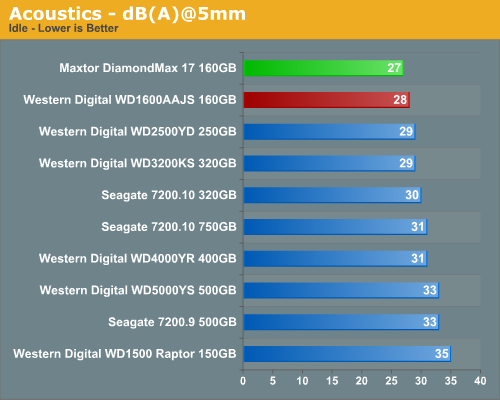
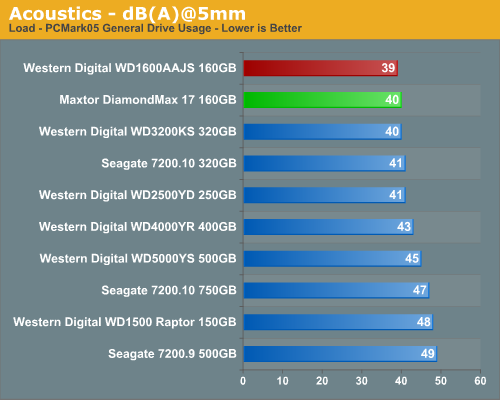
Our Western Digital and Maxtor 160GB samples are overall the quietest drives we have tested to date. Our subjective opinion is that the seek requests on the Maxtor drive are a little more pronounced than the WD 160GB drive but it was difficult to notice the drive's noise levels over the power supply fan during the majority of intensive read/write requests. Our base dB(A) level in the room at time of testing was 24 dB(A).
Hard Drive Performance: Thermals
Our thermal tests utilize sensor readings via the S.M.A.R.T. (Self-Monitoring, Analysis and Reporting Technology) capability of the drives and are reported by utilizing the Active SMART 2.42 utility. We test our drives in an enclosed case environment without the front fan operational to simulate temperatures that could conceivably be reached in a SFF or HTPC case design. We typically find the reported numbers drop anywhere from 18% to 25% on average when the front fan is operational.
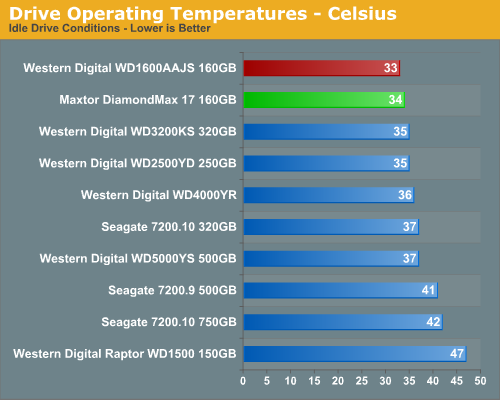
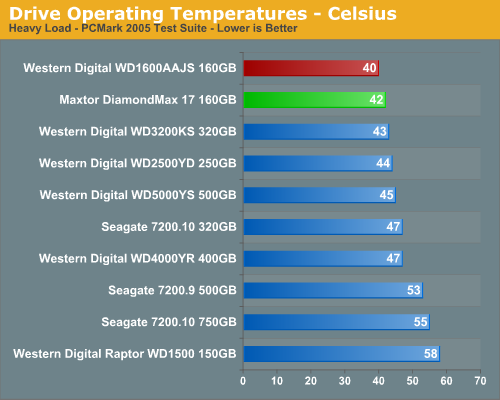
We expected the WD1600AAJS to run cool based upon our test results with the other Western Digital drives. It did not disappoint us in either test as even the casing remained cool to the touch after hours of continuous testing. The same held true for our Maxtor drive although under load it was slightly warmer than the WD drive over the course of testing. Looking strictly at the acoustic and thermal benchmarks we definitely would recommend the Western Digital drive for a SFF or HTPC system if capacity is not an issue.
Final Words
We really did not encounter too many surprises in our testing as the performance generated by both 160GB drives was close to what we expected. Both drives performed well and followed certain patterns throughout testing based upon their design and target audience. The overall performance of the drives placed them consistently in the middle to lower end of our test group; this should not be surprising considering the competition. These two drives are designed for single user desktops where cost, thermals, and acoustics are just as important as performance and capacity.
The one exception is the lackluster seek times posted by the Maxtor, which can be directly attributed to its frequently poor performance in many of the benchmarks. It is not clear exactly why the Maxtor drive performs so poorly in this aspect, as nearly all other 7200 RPM drives made in the past several years generate similar results. It could be that our test drives are faulty, or more likely it simply has firmware that is not ideally tuned for faster access times. Whether this can be fixed via a firmware update or not remains to be seen. However, even with the slower random seek times, the overall performance is still decent. On the other hand, the Maxtor drive does appear to be better tuned for write performance than many of the competing drives.
The Western Digital Caviar SE WD1600AAJS offered the best acoustics and thermals of any drive we have tested to date. Speaking of performance, the drive in our IPEAK tests was at times near the bottom of the group but usually placed ahead of the Maxtor 160GB drive, except in certain video/audio applications where the Maxtor's improved write performance resulted in better scores. In our platform applications tests the Western Digital drive performed very well considering its pedigree and finished with very good results overall for a drive that was not designed with absolute performance in mind.
What is our recommendation? If you are looking for a very quiet drive with excellent thermals then the Western Digital Caviar SE WD1600AAJS should be on your short list, as long as capacity is not an issue. The drive also offered good game play performance and was able to make a competitive showing in the general business application benchmarks. The WD 1600AAJS is currently selling for around $60 in the OEM version which offers a three year warranty instead of the retail drive's one year warranty and increased cost of $85. We find this drive to be a better bargain than the Maxtor DiamondMax 17 160GB drive selling for the same price, but we will reserve our final recommendations until we have tested competing drives from Samsung and Hitachi. However, with 320GB drives selling around a $90 price point and newer 500GB drives available for $150 now, we see the market for these 160GB being limited to those on a strict budget.
The introduction by Western Digital of their 160GB per-platter technology across the mainstream desktop product lines is occurring later than we had hoped, but we are finally seeing a wide selection of these drives in the retail market. What we look forward to is testing the new Western Digital SE16 WD5000AAKS series with the new three platter design to see how well the 160GB per-platter technology compares to the current high performance desktop 500GB offerings from Seagate, Samsung, and Hitachi. We expect this new drive will offer the improved thermals and acoustics of the 160GB drive while hopefully providing performance equal to or better than the venerable WD5000YS or Hitachi T7K500 drives.


