Original Link: https://www.anandtech.com/show/1371
Western Digital's Raptors in RAID-0: Are two drives better than one?
by Anand Lal Shimpi on July 1, 2004 12:00 PM EST- Posted in
- Storage
Parallelism has been a topic of interest within the PC technology industry ever since its inception. The basic principle of computing is to accomplish incredibly large and complicated tasks through the completion of smaller individual tasks, which in some cases, can be executed concurrently to maximize performance. We've seen examples of exploiting parallelism in computing with technologies such as multiprocessor systems, Hyper Threading and, of course, the long-missed Voodoo2 SLI.
The benefits of parallelism vary depending on the application. For example, the impact of dual processors or a Hyper Threading enabled CPU can be as little as 5% for a normal desktop user, but as much as 50% for a server system. Graphics rendering is virtually infinitely parallelizable, with a doubling in raw GPU power resulting in close to a doubling of performance. But what about hard drive performance? Are two drives better than one?
Of course, the technology that we are talking about is RAID, standing for Redundant Array of Independent (or Inexpensive) Disks. As the name implies, the technology was introduced for redundancy, but has morphed into a cheap way to add performance to your system. With the introduction of their 875P/865 chipsets, Intel brought the two simplest forms of RAID to desktop users for free: RAID 0 and RAID 1. With the majority of Intel's chipset shipments featuring RAID support, desktop users are beginning to experiment, now more than ever, with RAID as a method of increasing performance.
On paper, RAID can provide dramatic increases in performance. But as we've shown in our other hard drive reviews, the real world often differs greatly from the realm of synthetic disk benchmarks. So, what happens when you measure the real-world impact of RAID on today's fastest, most disk limited systems? Should we all start buying two hard drives instead of one? Or should RAID still be used for redundancy and not for performance when it comes to the average desktop user?
Let's find out...
Doubling Theoretical Performance: RAID-0
For those of you who are already familiar with RAID and how it works, go ahead and skip to the benchmarks; these next two pages are designed to serve as brief introductions to the two most common forms of RAID on the desktop: RAID-0 and RAID-1.Otherwise known as striping, RAID-0 is the only performance-enhancing form of RAID that we'll be talking about in this article. The premise behind striping is simple. Data being written to a drive is split into "stripes", generally 16 - 256KB in size, with each stripe being written to a different drive in the array. For example, say we were dealing with a 2-drive RAID-0 array with a stripe size of 128KB and we wanted to write 256KB of data; drive 0 would get the first 128KB of data written to it, and drive 1 would get the remaining 128KB.
Writing to a single hard disk
Writing to a two-disk RAID-0 array
Here, you can see that the write performance of RAID-0 can be almost double that of a single drive, since twice as much data gets written at the same time. The higher write performance is obtained at the expense of some controller overhead, since the RAID controller has to handle splitting up data into stripes before sending it to the drives themselves - but with modern day microprocessors being as fast as they are, the overhead is usually thought of as negligible.
Reading works the exact same way, but in reverse. Say that we want to read that same 256KB of data back; we pull one stripe from drive 0 and the other stripe from drive 1. The read is now completed in half the time, theoretically doubling performance.
We are careful to use the word "theoretical" because the performance advantages of RAID-0 disappear quickly if we're not dealing in ideal situations like the ones we just described. If too large of a stripe size is used, then the performance advantages of RAID-0 can be lost, while too small of a stripe size could result in excess overhead, reducing the performance improvement of the striped array.
We have seen in the past that for most desktop applications, the largest stripe size that a desktop RAID controller will offer is usually the best choice for performance. With Intel's ICH5/6, that translates into a 128KB stripe size, which for our comparison is what we decided to go with. The other stripe size options didn't offer any better performance for our desktop test suite.
The main downside to RAID-0, other than cost, is reliability. The size of a RAID-0 array is the sum of all of its members; so, two 100GB drives in a RAID-0 array will give you one array with a 200GB total capacity. Unfortunately, if you lose any one of the drives in the array, all of your data is lost and isn't recoverable. Since two drives are working in tandem and are both necessary to hold your data, you effectively halve the mean time between failure by moving to a two-drive RAID-0 array.
Putting the Redundancy in RAID: RAID-1
The next type of RAID that we'll talk about is RAID-1, otherwise known as mirroring. We won't be benchmarking RAID-1 here because, for the most part, there's no performance increase or decrease. As the title of this page implies, RAID-1 is done for redundancy.
Writing to a two-drive RAID-1 array
Unlike RAID-0, there is no preprocessing done on the data before it is sent to the hard drives. Instead, with RAID-1, a duplicate of everything written to drive 0 is written to its mirror drive. The benefit of RAID-1 is that if one drive fails, you have a perfectly working backup that can take over until you have replaced the failed drive. You have effectively doubled a single hard drive's mean time between failure by using two in a RAID-1 array. You'll notice that this is the exact opposite of RAID-0, but the downside to RAID-1 is that you spend twice as much on hard drives without getting any additional capacity or performance, just reliability.
The Test
Our hard drive test bed is designed to shift the bottlenecks, as much as possible, onto the hard drive, but while still within reason. To accomplish that purpose, our test bed is configured as follows:Intel Pentium 4 Extreme Edition 3.4GHz
Intel D875PBZ Motherboard
1GB DDR400 SDRAM
ATI Radeon 9800 Pro (128MB)
Creative Labs Audigy
Ultra ATA/100 or Serial ATA 150 cables were used where appropriate
The important drivers used are as follows:
Intel Chipset INF 5.1.1002
ATI Catalyst 4.5
Windows XP Service Pack 1 (no further updates were installed)
What's important to point out is that although we could have outfitted our test bed with 256MB of memory, we wanted to avoid over-exaggerating the performance impact of the hard drive. After all, if your system is swapping to disk a lot, you should be considering a memory upgrade before or in tandem with a hard drive upgrade.
The tests that we run are as follows:
Business Winstone IPEAK - a playback test of all of the IO operations that occur within Business Winstone 2004.
Content Creation IPEAK - a playback test of all of the IO operations that occur within Multimedia Content Creation Winstone 2004.
Business Winstone 2004 - the official Business Winstone 2004 test suite.
Multimedia Content Creation Winstone 2004 - the official Multimedia Content Creation Winstone 2004 test suite.
SYSMark 2004 - the official SYSMark 2004 test suite.
Far Cry Level Load Test - a timed test of loading a level in Far Cry.
Unreal Tournament 2004 Level Load Test - a timed test of loading a level in Unreal Tournament 2004.
More details about each individual test will appear in the section of the review dedicated to that particular test.
Pure Hard Disk Performance
To measure "pure" hard disk performance, we took a real world benchmark - in this case, the entire Winstone 2004 suite - and used Intel's IPEAK utility to capture a trace file of all of the IO operations that take place during a single run of Business Winstone 2004 and MCC Winstone 2004. We then use IPEAK to play back the trace, much like a timedemo, on each of the hard drives, which gives us a mean service time in milliseconds; in other words, the average time that each drive took to fulfill each IO operation.In order to make the data more understandable, we report the scores as an average number of IO operations per second so that higher scores translate into better performance.
Keep in mind that these performance scores are best only for comparing pure hard disk performance, and in no way do they reflect the actual real world performance impact of these hard drives.
For descriptions of what the Business and Multimedia Content Creation Winstone 2004 tests consist of, reference those benchmark pages.
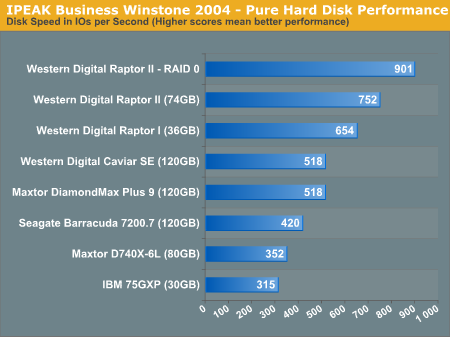
While a score of 901 IO operations per second seems impressive, what's important to note is that two Raptors in RAID-0 only offers 20% more performance than a single Raptor in this purely disk-bound test. We have already seen how aggressive caching, pre-fetching and other such real world elements of modern day computers reduce the impact of hard drive performance on overall system performance. With only a 20% improvement in pure disk performance, this doesn't bode too well for RAID-0 offering much of a real world performance boost.
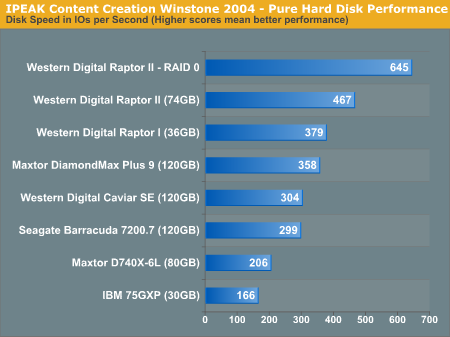
With data from audio editing as well as other more IO intensive tasks, our IPEAK recording of Content Creation Winstone 2004 shows much more potential for RAID-0, with the Raptor RAID-0 array outperforming a single drive by 38%.
Now, it's time to see how these numbers translate into real world performance.
Overall System Performance - Winstone
Historically, one of the most disk bound system performance tests has been the Winstone suite, composed of two benchmarks: Business Winstone 2004 and Multimedia Content Creation 2004.Business Winstone 2004 tests the following applications in various usage scenarios:
- Microsoft Access 2002
- Microsoft Excel 2002
- Microsoft FrontPage 2002
- Microsoft Outlook 2002
- Microsoft PowerPoint 2002
- Microsoft Project 2002
- Microsoft Word 2002
- Norton AntiVirus Professional Edition 2003
- WinZip 8.1
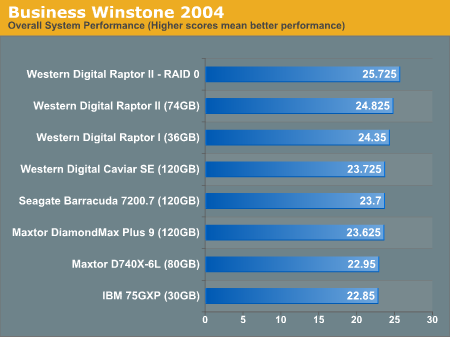
With only a 20% boost in pure IO performance, we weren't expecting much from the real world business performance of RAID-0 - and we weren't greeted with any surprises. Migrating to two Raptors in RAID-0 resulted in a 3.6% performance improvement; definitely not worth the added cost of a second drive as well as the decrease in reliability.
Multimedia Content Creation Winstone 2004 tests the following applications in various usage scenarios:
- Adobe® Photoshop® 7.0.1
- Adobe® Premiere® 6.50
- Macromedia® Director MX 9.0
- Macromedia® Dreamweaver MX 6.1
- Microsoft® Windows MediaTM Encoder 9 Version 9.00.00.2980
- NewTek's LightWave® 3D 7.5b
- SteinbergTM WaveLabTM 4.0f
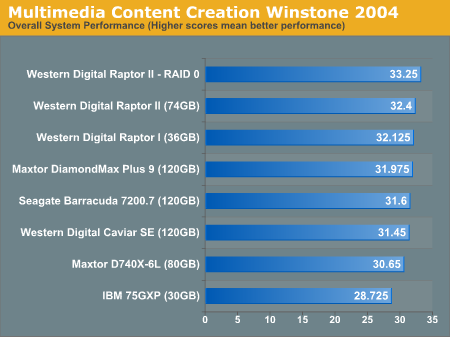
Although we saw a bigger theoretical performance improvement with Content Creation Winstone 2004 in our IPEAK tests, the real world improvement is even smaller than in the previous test; 2.6% is the only benefit that RAID-0 will give you here.
Overall System Performance - SYSMark
SYSMark 2004 is divided into two separate suites: Internet Content Creation and Office Productivity. What makes SYSMark an ideal hard disk benchmark is that its scores are totals of response times, meaning that the benchmark measures how long the system takes to respond to a task (e.g. how long before a search and replace is completed after it is initiated) and sums up all such response times to generate a score. This score is generated for six total subcategories: three under Internet Content Creation and three under Office Productivity.For the most part, SYSMark is CPU/platform bound, but we will see some variations in performance according to disk speed. At the same time, there are a couple of benchmarks within SYSMark that are heavily disk dependent.
First, we start with Internet Content Creation performance; the first category that we will deal with is 3D Content Creation. The tests that make up this benchmark are described below:
"The user renders a 3D model to a bitmap using 3ds max 5.1, while preparing web pages in Dreamweaver MX. Then the user renders a 3D animation in a vector graphics format."
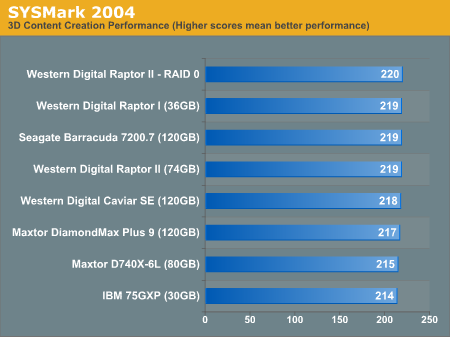
As we've seen in the past, 3D content creation performance is rarely influenced by hard disk speed (unless your workstation is grossly underpowered in memory size), and thus, we see no improvement from a two-drive RAID-0 array.
Next, we have 2D Content Creation performance:
"The user uses Premiere 6.5 to create a movie from several raw input movie cuts and sound cuts and starts exporting it. While waiting on this operation, the user imports the rendered image into Photoshop 7.01, modifies it and saves the results. Once the movie is assembled, the user edits it and creates special effects using After Effects 5.5."
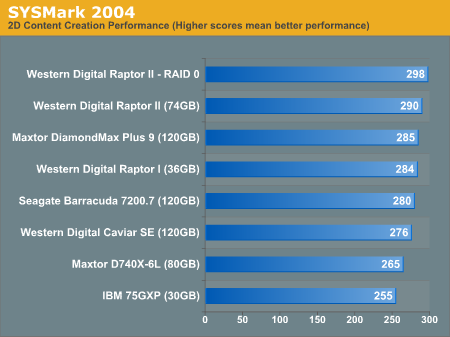
There's a small 2.8% performance boost from RAID-0 here, but once again, nothing to write home about and nothing worth the added cost.
The Internet Content Creation suite is rounded up with a Web Publishing performance test:
"The user extracts content from an archive using WinZip 8.1. Meanwhile, he uses Flash MX to open the exported 3D vector graphics file. He modifies it by including other pictures and optimizes it for faster animation. The final movie with the special effects is then compressed using Windows Media Encoder 9 series in a format that can be broadcast over broadband Internet. The web site is given the final touches in Dreamweaver MX and the system is scanned by VirusScan 7.0."
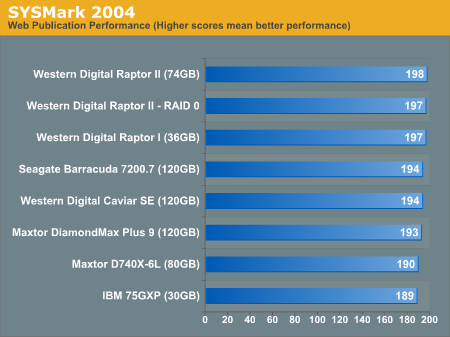
Once again, we're left with virtually identical performance between the RAID-0 and single drive Raptor configurations. The average of our three SYSMark runs have actually left the single drive Raptor II slightly ahead of the RAID-0 array, but that's normal variation between the benchmark runs.
Office Productivity Performance - SYSMark
SYSMark's Office Productivity suite consists of three tests, the first of which is the Communication test. The Communication test consists of the following:"The user receives an email in Outlook 2002 that contains a collection of documents in a zip file. The user reviews his email and updates his calendar while VirusScan 7.0 scans the system. The corporate web site is viewed in Internet Explorer 6.0. Finally, Internet Explorer is used to look at samples of the web pages and documents created during the scenario."
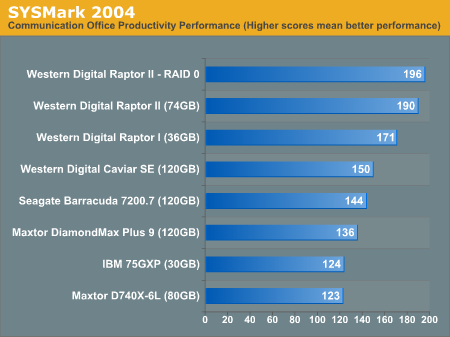
The Communication test generally shows decent differences between drives, but we see here that RAID-0 brings just over a 3% performance boost. In one of our most disk-influenced tests of the suite, the nail is beginning to shut the coffin for RAID-0 on the desktop.
The next test is Document Creation performance, which shows very little difference in drive performance between the contenders:
"The user edits the document using Word 2002. He transcribes an audio file into a document using Dragon NaturallySpeaking 6. Once the document has all the necessary pieces in place, the user changes it into a portable format for easy and secure distribution using Acrobat 5.0.5. The user creates a marketing presentation in PowerPoint 2002 and adds elements to a slide show template."
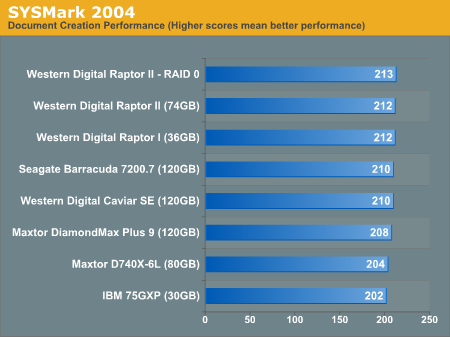
Once again, we see identical performance between the RAID-0 and single drive setups.
The final test in our Office Productivity suite is Data Analysis, which BAPCo describes as:
"The user opens a database using Access 2002 and runs some queries. A collection of documents are archived using WinZip 8.1. The queries' results are imported into a spreadsheet using Excel 2002 and are used to generate graphical charts."
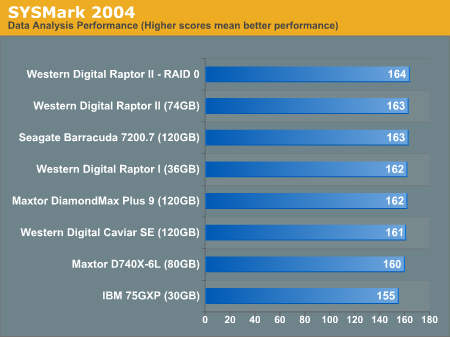
To finish off our individual SYSMark tests, our comments are little more than echoed once more with these results; RAID-0 does nothing for desktop performance.
SYSMark Performance Summary
The overall SYSMark scores summarize what we've seen thus far: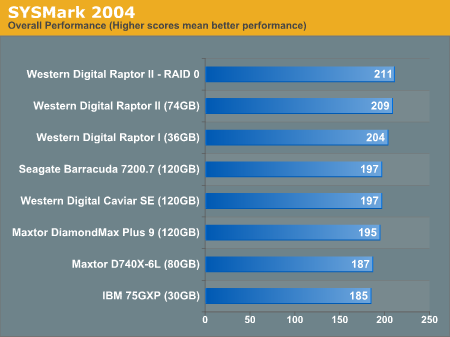
The overall SYSMark performance graph pretty much says it all - a slight, but completely unnoticeable, performance increase, thanks to RAID-0, is what buying a second drive will get you.
As a recap, here's what happens with the Internet Content Creation suite:
"In this scenario, the content creator creates a product-related website targeting a broadband and narrowband audience. The user first renders a 3D model to a bitmap, while preparing web pages using a web site publishing tool. The user opens a video editing package, creates a movie from several raw input movie cuts and sound cuts and starts exporting it. While waiting on this operation, the user imports the rendered image into an image-processing package, modifies it and saves the results. Back in the 3D modeling software, the user modifies a 3D model and exports it to a vector-graphics format. Once the movie is assembled, the user edits it and creates special effects using one of the modified images as input. The user extracts content from an archive. Meanwhile, he uses an animation creation tool to open the exported 3D vector graphics file. He modifies it by including other pictures and optimizes it for faster animation. The final movie with the special effects is then compressed in a format that can be broadcast over broadband Internet. The web site is given the final touches and the system is scanned for viruses."
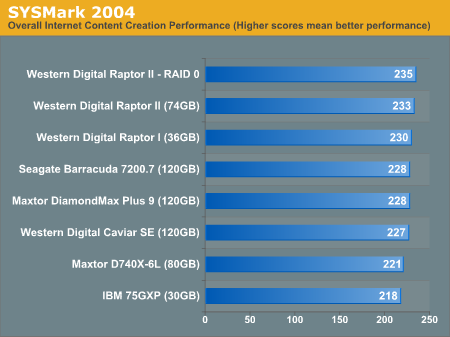
The trend continues with overall Internet Content Creation performance.
Also recapping, here's what happens in the entire Office Productivity suite:
"In this scenario, the office productivity user creates a marketing presentation and supporting documents for a new product. The user receives email containing a collection of documents in a compressed file. The user reviews his email and updates his calendar while a virus checking software scans the system. The corporate web site is viewed and the user begins creating the collateral documents. The user also accesses a database and runs some queries. A collection of documents are compressed. The queries' results are imported into a spreadsheet and used to generate graphical charts. The user then transcribes a document. Once the document has all the necessary pieces in place, the user changes it into a portable format for easy and secure distribution. The user edits and adds elements to a slide show template. Finally, the user looks at the results of his work (both the slide show and the portable document) in an Internet browser."
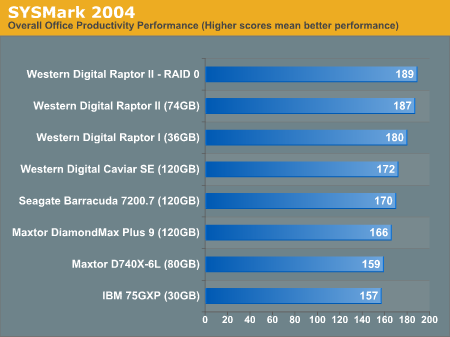
Even in our office productivity tests, we see that RAID-0 basically yields no performance improvement.
Game Loading Performance
For our game loading tests, we used two games: Far Cry and Unreal Tournament 2004. Both games were installed, in full, to the hard drive. We then used no-CD patches to prevent any accessing of the CD/DVD drive to skew the loading process. Both games were installed to a clean drive without anything else present on the drive (the OS is located on a separate drive).Our Far Cry test consists of starting a campaign with the default difficulty level, hitting escape to skip the introductory movie and beginning the stop watch timer at first sight of the loading screen. The stop watch timer is stopped as soon as the loading screen disappears. The test is repeated three times with the final score reported being an average of the three. In order to avoid the effects of caching, we reboot between runs. All times are reported in seconds; lower scores, obviously, being better.
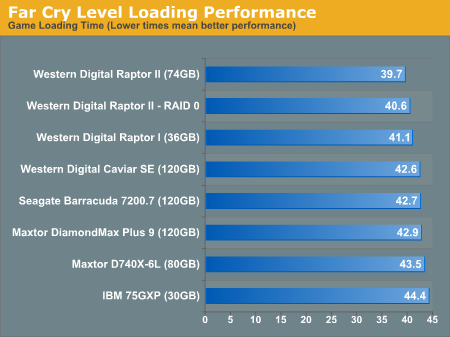
We were hoping to see some sort of performance increase in the game loading tests, but the RAID array didn't give us that. While the scores put the RAID-0 array slightly slower than the single drive Raptor II, you should also remember that these scores are timed by hand and thus, we're dealing within normal variations in the "benchmark".
Our Unreal Tournament 2004 test uses the full version of the game and leaves all settings on defaults. After launching the game, we select Instant Action from the menu, choose Assault mode and select the Robot Factory level. The stop watch timer is started right after the Play button is clicked, and stopped when the loading screen disappears. The test is repeated three times with the final score reported being an average of the three. In order to avoid the effects of caching, we reboot between runs. All times are reported in seconds; lower scores, obviously, being better.
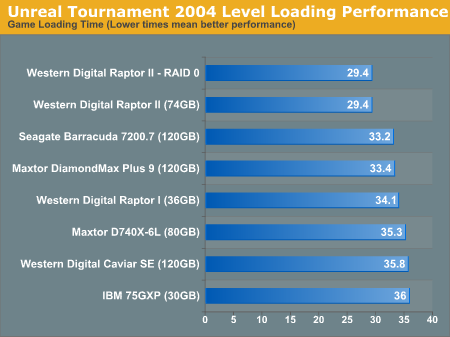
In Unreal Tournament, we're left with exactly no performance improvement, thanks to RAID-0.
Final Words
If you haven't gotten the hint by now, we'll spell it out for you: there is no place, and no need for a RAID-0 array on a desktop computer. The real world performance increases are negligible at best and the reduction in reliability, thanks to a halving of the mean time between failure, makes RAID-0 far from worth it on the desktop.There are some exceptions, especially if you are running a particular application that itself benefits considerably from a striped array, and obviously, our comments do not apply to server-class IO of any sort. But for the vast majority of desktop users and gamers alike, save your money and stay away from RAID-0.
If you do insist on getting two drives, you are much better off putting them into a RAID-1 array to have a live backup of your data. The performance hit of RAID-1 is just as negligible as the performance gains of RAID-0, but the improvement in reliability is worthwhile...unless you're extremely unlucky and both of your drives die at the exact same time.
When Intel introduced ICH5, and now with ICH6, they effectively brought RAID to the mainstream, pushing many users finally to bite the bullet and buy two hard drives for "added performance". While we applaud Intel for bringing the technology to the mainstream, we'd caution users out there to think twice before buying two expensive Raptors or any other drive for performance reasons. Your system will most likely run just as fast with only one drive, but if you have the spare cash, a bit more reliability and peace of mind may be worth setting up a RAID-1 array.
Bottom line: RAID-0 arrays will win you just about any benchmark, but they'll deliver virtually nothing more than that for real world desktop performance. That's just the cold hard truth.


