VIA KT333 Motherboard Roundup - June 2002
by Anand Lal Shimpi on June 13, 2002 5:41 AM EST- Posted in
- Motherboards
On-board Audio Quality & Performance
When we first introduced this section into our motherboard roundups we focused almost exclusively on performance. We did some rudimentary verifications of audio output quality but there was nothing serious at all. Armed with RightMark's Audio Analyzer we were able to perform some more objective tests on the audio output quality of these on-board audio codecs.
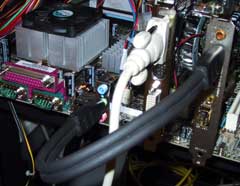
The Audio Analyzer hardware setup
The way Audio Analyzer works is simple; you run a cable from the output of the sound device being measured and run it into the input of either the same device or a separate sound card. Sounds are then played from the device being tested and recorded at the same time; the signals are then compared and analyzed with their differences being summed up through a number of performance scores. The test obviously depends on the recording equipment just as much as the playback device so in order to keep things on a level playing field all of our recording was done using a SB Audigy; it's not the highest end card in the world but it provides a good reference point.
The only boards to be omitted from this test were the ABIT KX7-333 (because it has no on-board audio), the DFI AD76 RAID (because audio wasn't working properly in the preproduction BIOS) and the Soyo KT333 Dragon Ultra (because the board would not POST with our Audigy installed).
Audio Analyzer outputs ratings in six separate categories rating the output quality of the signal that is played back using the audio device being tested. The ratings range from Very Poor, Poor, Average, Good, Very Good and finally Excellent; the higher the rating the better. We won't get into too deep of an explanation behind these terms but here's what to look for:
Frequency Response - audio occurs at various frequencies (the human ear can perceive frequencies from 20Hz up to 20kHz), the frequency response of the audio device determines what frequencies can be accurately reproduced and what frequencies will be lost or reduced in volume. Generally the higher and lower frequencies are the ones that suffer the most, so an above average frequency response curve would be relatively flat from start to finish.
Dynamic Range - this gives you an idea of how well weak signals will be reproduced.
THD - Total Harmonic Distortion is best explained by the folks at RightMark:
"THD (total harmonic distortion) is a level of (usually unwanted) harmonics generated in the sound device. Usually high quality devices have a low THD value (lower than 0.002%), but there are exceptions. Many tube devices have rather high THD level, which makes their sound “warm”. But transistor devices must have low THD, because their (odd) harmonics don’t make the sound pleasant. "
The Noise level and Stereo crosstalk ratings should be fairly self explanatory.
|
Audio
Output Quality Comparison
|
||||||
|
Frequency
response (from 40 Hz to 15 kHz)
|
Noise
level
|
Dynamic
range
|
THD
|
IMD
|
Stereo
crosstalk
|
|
| ABIT AT7 |
Average
|
Good
|
Good
|
Very
Good
|
Poor
|
Excellent
|
| ASUS A7V333 |
Poor
|
Good
|
Good
|
Average
|
Very
Poor
|
Very
Good
|
| ECS K7VTA3 |
Good
|
Good
|
Good
|
Very Good |
Good
|
Very
Good
|
| EPoX 8K3A+ |
Good
|
Very
Poor
|
Very
Poor
|
Good
|
Poor
|
Poor
|
| Gigabyte GA-7VRXP |
Good
|
Good
|
Good
|
Very Good |
Average
|
Very
Good
|
| MSI KT3 Ultra |
Good
|
Average
|
Average
|
Very
Good
|
Poor
|
Good
|
| Shuttle AK35GT2/R |
Poor
|
Good
|
Average
|
Average
|
Very
Poor
|
Very
Good
|
What's interesting to note here is that implementation as well as the specific codec itself greatly control the quality of the output. For example, the ABIT AT7 and the EPoX 8K3A+ use the same ALC650 codec yet they have dramatically different output characteristics.
It's interesting to note that the motherboard with the best output quality was the ECS K7VTA3 that used the older ALC201A codec. Obviously we don't have enough information to judge whether this superiority is caused by the codec or by ECS' engineering team, but it's an interesting observation nonetheless.


0 Comments
View All Comments