The Nehalem Preview: Intel Does It Again
by Anand Lal Shimpi on June 5, 2008 12:05 AM EST- Posted in
- CPUs
Faster Unaligned Cache Accesses & 3D Rendering Performance
3dsmax r9
Our benchmark, as always, is the SPECapc 3dsmax 8 test but for the purpose of this article we only run the CPU rendering tests and not the GPU tests.
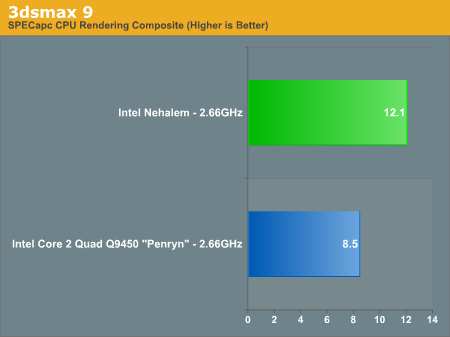
The results are reported as render times in seconds and the final CPU composite score is a weighted geometric mean of all of the test scores.
| CPU / 3dsmax Score Breakdown | Radiosity | Throne Shadowmap | CBALLS2 | SinglePipe2 | Underwater | SpaceFlyby | UnderwaterEscape |
| Nehalem (2.66GHz) | 12.891s | 11.193s | 5.729s | 20.771s | 24.112s | 30.66s | 27.357s |
| Penryn (2.66GHz) | 19.652s | 14.186s | 13.547s | 30.249s | 32.451s | 33.511s | 31.883s |
The CBALLS2 workload is where we see the biggest speedup with Nehalem, performance more than doubles. It turns out that CBALLS2 calls a function in the Microsoft C Runtime Library (msvcrt.dll) that can magnify the Core architecture's performance penalty when accessing data that is not aligned with cache line boundaries. Through some circuit tricks, Nehalem now has significantly lower latency unaligned cache accesses and thus we see a huge improvement in the CBALLS2 score here. The CBALLS2 workload is the only one within our SPECapc 3dsmax test that really stresses the unaligned cache access penalty of the current Core architecture, but there's a pretty strong performance improvement across the board in 3dsmax.
Nehalem is just over 40% faster than Penryn, clock for clock, in 3dsmax.
Cinebench R10
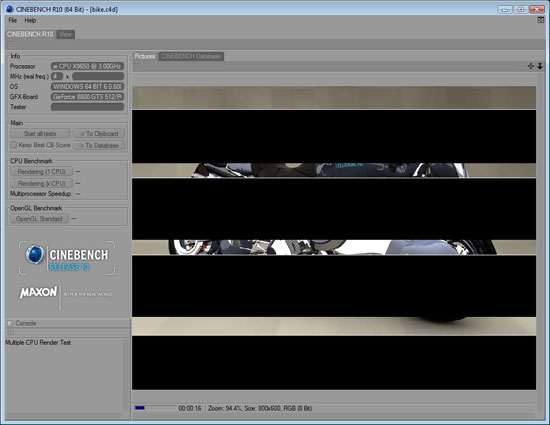
A benchmarking favorite, Cinebench R10 is designed to give us an indication of performance in the Cinema 4D rendering application.
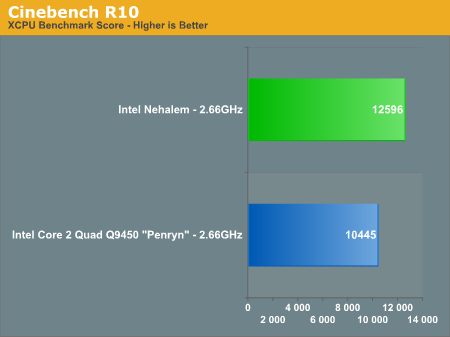
Cinebench also shows healthy gains with Nehalem, performance went up 20% clock for clock over Penryn.
We also ran the single-threaded Cinebench test to see how performance improved on an individual core basis vs. Penryn (Updated: The original single-threaded Penryn Cinebench numbers were incorrect, we've included the correct ones):
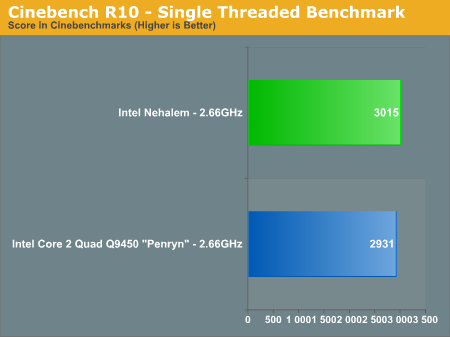
Cinebench shows us only a 2% increase in core-to-core performance from Penryn to Nehalem at the same clock speed. For applications that don't go out to main memory much and can stay confined to a single core, Nehalem behaves very much like Penryn. Remember that outside of the memory architecture and HT tweaks to the core, Nehalem's list of improvements are very specific (e.g. faster unaligned cache accesses).
The single thread to multiple thread scaling of Penryn vs. Nehalem is also interesting:
| Cinebench R10 | 1 Thread | N-Threads | Speedup |
| Nehalem (2.66GHz) | 3015 | 12596 | 4.18x |
| Core 2 Quad Q9450 - Penryn - (2.66GHz) | 2931 | 10445 | 3.56x |
The speedup confirms what you'd expect in such a well threaded FP test like Cinebench, Nehalem manages to scale better thanks to Hyper Threading. If Nehalem had the same 3.56x scaling factor that we saw with Penryn it would score a 10733, virtually inline with Penryn. It's Hyper Threading that puts Nehalem over the edge and accounts for the rest of the gain here.
While many 3D rendering and video encoding tests can take at least some advantage of more threads, what about applications that don't? One aspect of Nehalem's performance we're really not stressing much here is its IMC performance since most of these benchmarks ended up being more compute intensive. Where HT doesn't give it the edge, we can expect some pretty reasonable gains from Nehalem's IMC alone. The Nehalem we tested here is crippled in that respect thanks to a premature motherboard, but gains on the order of 20% in single or lightly threaded applications is a good expectation to have.
POV-Ray 3.7 Beta 24
POV-Ray is a popular raytracer, also available with a built in benchmark. We used the 3.7 beta which has SMP support and ran the built in multithreaded benchmark.
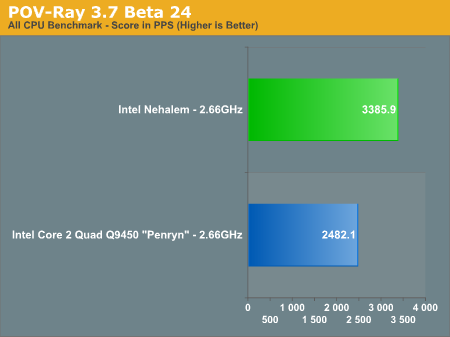
Finally POV-Ray echoes what we've seen elsewhere, with a 36% performance improvement over the 2.66GHz Core 2 Q9450. Note that Nehalem continues to be faster than even the fastest Penryns available today, despite the lower clock speed of this early sample.


108 Comments
View All Comments
weihlmus - Friday, September 5, 2008 - link
is it just me or does lga1366 bear more than apassing resemblance to amd's logo...if only they could have crammed it into 1337 pins - "nehalem - the 1337 chip"
Proteusza - Friday, July 11, 2008 - link
I see that on the Daily Tech main page, the headline for this article now reads:"June 5, 2008
Post date on AnandTech's Nehalem preview, before it was ripped and republished on Tom's Hardware"
Does anyone know what happened? I cant find the same article on Tomshardware, I presume they took it down.
xsilver - Friday, June 20, 2008 - link
10 pages of comments and not one about the future of overclocking?No more FSB = no more overclocking??????
Enthusiasts might jump ship if overclocking usually brings 20% extra performance, all amd have to do is come within 10% on performance and below on price?
Akabeth - Thursday, June 19, 2008 - link
JebuzzzThis pretty much makes it pointless to purchase any high tier mobo and quad core today... It will be eclipsed in 6 months time...
Some of the numbers here make me wonder, "Are you f*cking kidding me?"
JumpingJack - Friday, June 13, 2008 - link
Anand, you could clear up some confusion if you could specify the version of windows you ran. The screen shots of some of your benchmarks show 64-bit Vista, yet your scores are inline with 32-bit Vista.... it makes a difference.JumpingJack - Friday, June 13, 2008 - link
Nevermind, page 2 shows 32-bit Vista... makes sense now. You should becareful when posting stock photos, the Cinbench reflects 64-bit.barnierubble - Sunday, June 8, 2008 - link
It appears to me that the Tick Tock cycle diagram is wrong.Conroe shooked the world in the second half of 2006, Penryn came in the second half of 2007, now 2008 we have Nehalem on the horizon set for the second half of this year.
Now that is 2 years between new architectures with the intermediate year bringing a shrink derivative.
That is not what the diagram shows; bracketing shrink derivative and new architecture in a 2 year cycle is clearly not fitting the reality.
mbf - Saturday, June 7, 2008 - link
Will the new IMC support ECC RAM? And if so, what are the odds the consumer versions will too? I've had a bit of bad luck with memory errors in the past. Since then I swear by ECC memory, even though it costs me a bit of performance. :)Natima - Saturday, June 7, 2008 - link
I just thought I'd point out that the Bloomfield chip reviewed (to be released in H2 2008) will infact dominate the gamer/high-end market.http://en.wikipedia.org/wiki/Nehalem_(microarchite...">http://en.wikipedia.org/wiki/Nehalem_(microarchite...
The smaller sockets will be for what I like to call... "office PC's".
And the larger socket for high-end servers.
A majority of custom PC builders will be able to buy & use Nehalems by the end of the year. Hoorah!
Natima - Saturday, June 7, 2008 - link
The article semi-implied that chips for the PC enthusiast would not be out until mid-2009. Just wanted to clarify this for people.