The NVIDIA GeForce GTX 980 Review: Maxwell Mark 2
by Ryan Smith on September 18, 2014 10:30 PM ESTCompute
On the other hand compared to our Kepler cards GTX 980 introduces a bunch of benefits. Higher CUDA core occupancy is going to be extremely useful in compute benchmarks. So will the larger L2 cache and the 96KB per SMM of shared memory. Even more important, compares to GK104 (GTX 680/770) GTX 980 inherits the compute enhancements that were introduced in GK110 (GTX 780/780 Ti) including changes that relieved pressure on register file bandwidth and capacity. So although GTX 980 is not strictly a compute card – it is first and foremost a graphics card – it has a lot of resources available to spend on compute.
As always we’ll start with LuxMark2.0, the official benchmark of SmallLuxGPU 2.0. SmallLuxGPU is an OpenCL accelerated ray tracer that is part of the larger LuxRender suite. Ray tracing has become a stronghold for GPUs in recent years as ray tracing maps well to GPU pipelines, allowing artists to render scenes much more quickly than with CPUs alone.
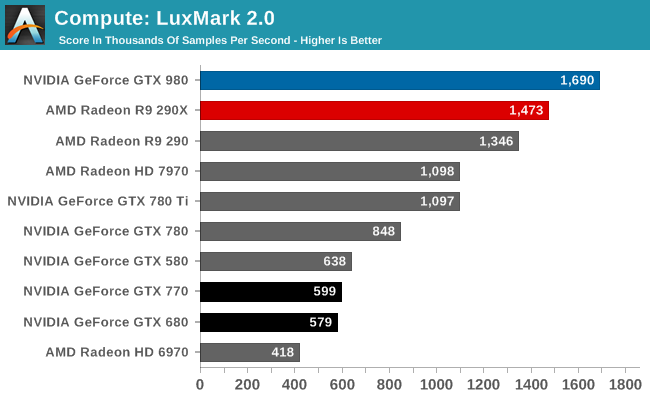
Out of the gate GTX 980 takes off like a rocket. AMD’s cards could easily best even GTX 780 Ti here, but GTX 980 wipes out AMD’s lead and then some. At 1.6M samples/sec, GTX 980 Ti is 15% faster than R9 290X and 54% faster than GTX 780 Ti. This, as it’s important to remind everyone, is for a part that technically only has 71% of the CUDA cores of GTX 780 Ti. So per CUDA core, GTX 980 delivers over 2x the LuxMark performance of GTX 780 Ti. Meanwhile against GTX 680 and GTX 780 the lead is downright silly. GTX 980 comes close to tripling its GK104 based predecessors.
I’ve spent some time pondering this, and considering that GTX 750 Ti looked very good in this test as well it’s clear that Maxwell’s architecture has a lot to do with this. I don’t know if NVIDIA hasn’t also been throwing in some driver optimizations here, but a big part is being played by parts of the architecture. GTX 750 Ti and GTX 980 both share the general architecture and 2MB of L2 cache, while it seems like we can run out GTX 980’s larger 96KB shared memory since GTX 750 Ti did not have that. This may just come down to those CUDA core occupancy improvements, especially if you start comparing GTX 980 to GTX 780 Ti.
For our second set of compute benchmarks we have CompuBench 1.5, the successor to CLBenchmark. We’re not due for a benchmark suite refresh until the end of the year, however as CLBenchmark does not know what to make of GTX 980 and is rather old overall, we’ve upgraded to CompBench 1.5 for this review.
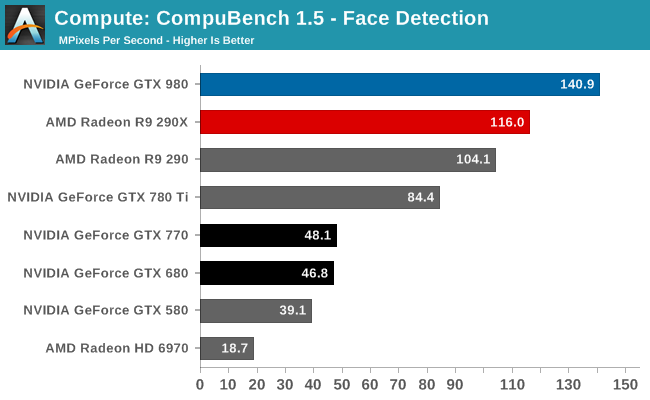
The first sub-benchmark is Face Detection, which like LuxMark puts GTX 980 in a very good light. It’s quite a bit faster than GTX 780 Ti or R9 290X, and comes close to trebling GTX 680.
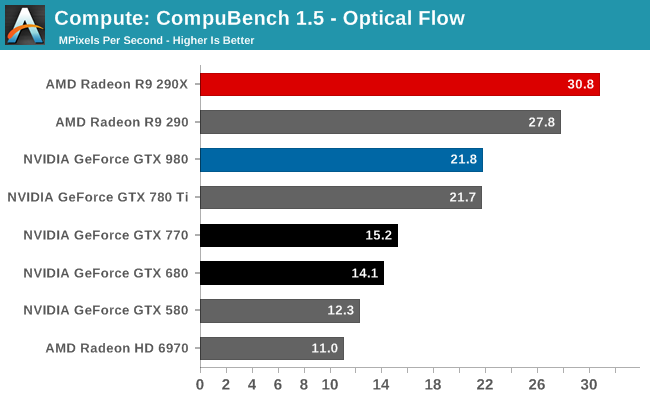
The second sub-benchmark of Optical Flow on the other hand sees AMD put GTX 980 in its place. GTX 980 fares only as well as GTX 780 Ti here, which means performance per CUDA core is up, but not enough to offset the difference in cores. And it doesn’t get GTX 980 anywhere close to beating R9 290X. As a computer vision test this can be pretty memory bandwidth intensive, so this may be a case of GTX 980 succumbing to its lack of memory bandwidth rather than a shader bottleneck.
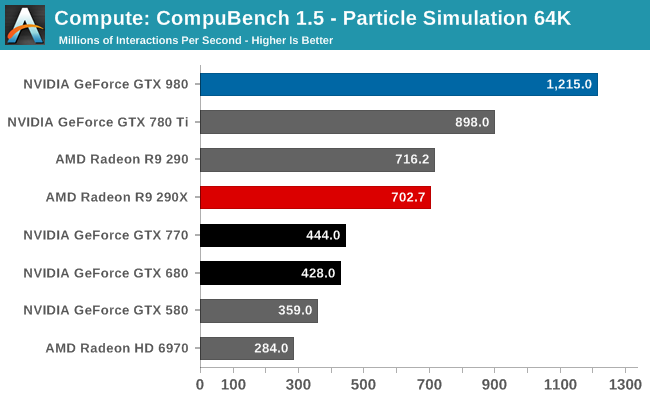
The final sub-benchmark of the particle simulation puts GTX 980 back on top, and by quite a lot. NVIDIA does well in this benchmark to start with – GTX 780 Ti is the number 2 result – and GTX 980 only improves on that. It’s 35% faster than GTX 780 Ti, 73% faster than R9 290X, and GTX 680 is nearly trebled once again. CUDA core occupancy is clearly a big part of these results, though I wonder if the L2 cache and shared memory increase may also be playing a part compared to GTX 780 Ti.
Our 3rd compute benchmark is Sony Vegas Pro 12, an OpenGL and OpenCL video editing and authoring package. Vegas can use GPUs in a few different ways, the primary uses being to accelerate the video effects and compositing process itself, and in the video encoding step. With video encoding being increasingly offloaded to dedicated DSPs these days we’re focusing on the editing and compositing process, rendering to a low CPU overhead format (XDCAM EX). This specific test comes from Sony, and measures how long it takes to render a video.
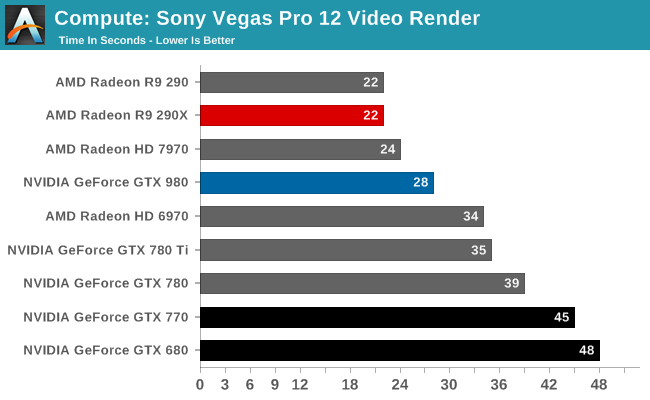
Traditionally a benchmark that favored AMD, the GTX 980 doesn’t manage to beat the R9 290X, but it closes the gap significantly compared to GTX 780 Ti. This test is a mix of simple shaders and blends, so it’s likely we’re seeing a bit of both here. More ROPs for more blending, and improved shader occupancy for when the task is shader-bound.
Moving on, our 4th compute benchmark is FAHBench, the official Folding @ Home benchmark. Folding @ Home is the popular Stanford-backed research and distributed computing initiative that has work distributed to millions of volunteer computers over the internet, each of which is responsible for a tiny slice of a protein folding simulation. FAHBench can test both single precision and double precision floating point performance, with single precision being the most useful metric for most consumer cards due to their low double precision performance. Each precision has two modes, explicit and implicit, the difference being whether water atoms are included in the simulation, which adds quite a bit of work and overhead. This is another OpenCL test, utilizing the OpenCL path for FAHCore 17.
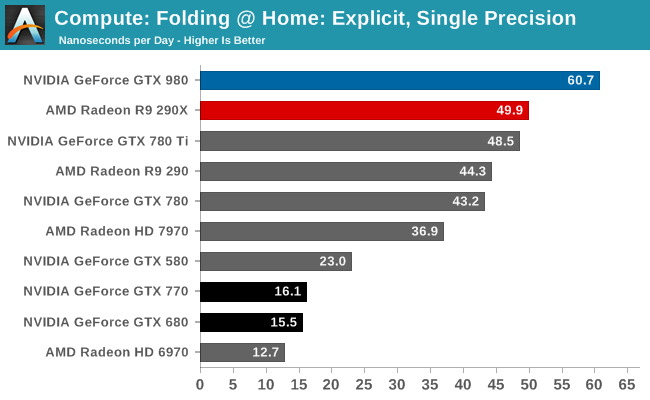
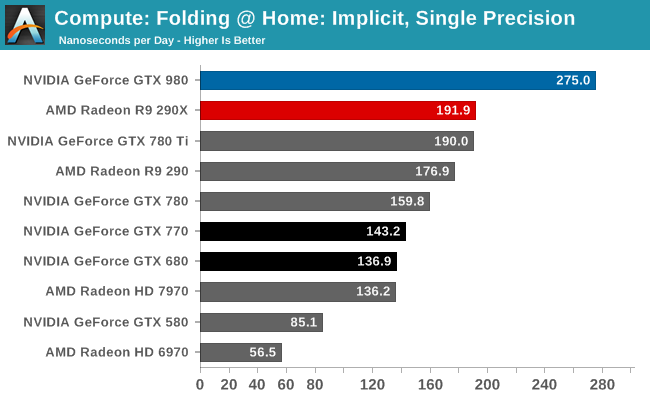
This is another success story for the GTX 980. In both single precision tests the GTX 980 comes out on top, holding a significant lead over the R9 290X. Furthermore we’re seeing some big performance gains over GTX 780 Ti, and outright massive gains over GTX 680, to the point that GTX 980 comes just short of quadrupling GTX 680’s performance in single precision explicit. This test is basically all about shading/compute, so we expect we’re seeing a mix of improvements to CUDA core occupancy, shared memory/cache improvements, and against GTX 680 those register file improvements.
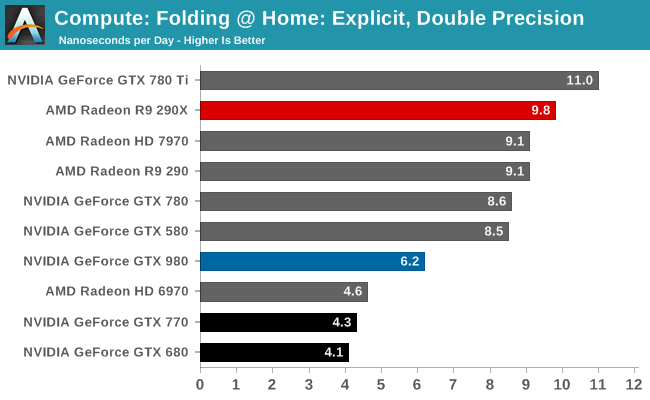
Double precision on the other hand is going to be the GTX 980’s weak point for obvious reasons. GM204 is a graphics GPU first and foremost, so it only has very limited 1:32 rate FP64 performance, leaving it badly outmatched by anything with a better rate. This includes GTX 780/780 Ti (1:24), AMD’s cards (1:8 FP64), and even ancient GTX 580 (1:8). If you want to do real double precision work, NVIDIA clearly wants you buying their bigger, compute-focused products such as GTX Titan, Quadro, and Tesla.
Wrapping things up, our final compute benchmark is an in-house project developed by our very own Dr. Ian Cutress. SystemCompute is our first C++ AMP benchmark, utilizing Microsoft’s simple C++ extensions to allow the easy use of GPU computing in C++ programs. SystemCompute in turn is a collection of benchmarks for several different fundamental compute algorithms, with the final score represented in points. DirectCompute is the compute backend for C++ AMP on Windows, so this forms our other DirectCompute test.
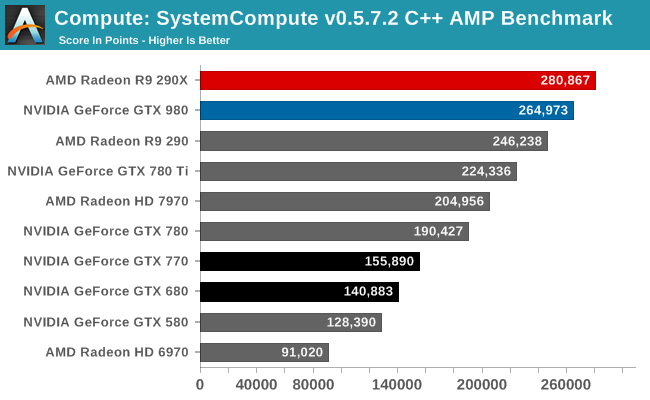
Once again NVIDIA’s compute performance is showing a strong improvement, even under DirectCompute. 17% over GTX 780 Ti and 88% over GTX 680 shows that NVIDIA is getting more work done per CUDA core than ever before. Though this won’t be enough to surpass the even faster R9 290X.
Overall, while NVIDIA can’t win every compute benchmark here, the fact that they are winning so many and by so much – and otherwise not terribly losing the rest – shows that NVIDIA and GM204 have corrected the earlier compute deficiencies in GK104. As an x04 part GM204 may still be first and foremost consumer graphics, but if it’s faced with a compute workload most of the time it’s going to be able to power on through it just as well as it does with games and other graphical workloads.
It would be nice to see GPU compute put to better use than it is today, and having strong(er) compute performance in consumer parts is going to be one of the steps that needs to happen for that outcome to occur.


274 Comments
View All Comments
Frenetic Pony - Friday, September 19, 2014 - link
This is the most likely thing to happen, as the transition to 14nm takes place for intel over the next 6 months those 22nm fabs will sit empty. They could sell capacity at a similar process to TSMC's latest while keeping their advantage at the same time.nlasky - Friday, September 19, 2014 - link
Intel uses the same Fabs to produce 14nm as it does to produce 22nmlefty2 - Friday, September 19, 2014 - link
I can see Nvidia switching to Intel's 14nm, however Intel charges a lot more than TSMC for it's foundry services (because they want to maintain their high margins). That would mean it's only economical for the high end cardsSeanJ76 - Friday, September 19, 2014 - link
What a joke!!!! 980GTX doesn't even beat the previous year's 780ti??? LOL!! Think I'll hold on to my 770 SC ACX Sli that EVGA just sent me for free!!Margalus - Friday, September 19, 2014 - link
uhh, what review were you looking at? or are you dyslexic and mixed up the results between the two cards?eanazag - Friday, September 19, 2014 - link
Nvidia would get twice as many GPUs per wafer on a 14nm process than 28nm. Maxwell at 14nm would blow Intel integrated and AMD out of the water in performance and power usage.That simply isn't the reality. Samsung has better than 28nm processes also. This type of partnership would work well for Nvidia and AMD to partner with Samsung on their fabs. It makes more sense than Intel because Intel views Nvidia as a threat and competitor. There are reasons GPUs are still on 28nm and it is beyond process availability.
astroidea - Friday, September 19, 2014 - link
They'd actually get four times more since you have to considered the squared area. 14^2*4=28^2emn13 - Saturday, September 20, 2014 - link
Unfortunately, that's not how it works. A 14nm process isn't simply a 28nm process scaled by 0.5; different parts are scaled differently, and so the overall die area savings aren't that simple to compute.In a sense, the concept of a "14nm" process is almost a bit of a marketing term, since various components may still be much larger than 14nm. And of course, the same holds for TSMC's 28nm process... so a true comparison would require more knowledge that you or I have, I'm sure :-) - I'm not sure if intel even releases the precise technical details of how things are scaled in the first place.
bernstein - Friday, September 19, 2014 - link
no because intel is using their 22nm for haswell parts... the cpu transition ends in a year with the broadwell xeon-ep... at which point almost all the fabs will either be upgraded or upgrading to 14nm and the rest used to produce chipsets and other secondary die'snlasky - Saturday, September 20, 2014 - link
yes but they use the same fabs for both processes