The AMD Radeon R9 290X Review
by Ryan Smith on October 24, 2013 12:01 AM EST- Posted in
- GPUs
- AMD
- Radeon
- Hawaii
- Radeon 200
Compute
Jumping into pure compute performance, we’re going to have several new factors influencing the 290X as compared to the 280X. On the front end 290X/Hawaii has those 8 ACEs versus 280X/Tahiti’s 2 ACEs, potentially allowing 290X to queue up a lot more work and to keep itself better fed as a result; though in practice we don’t expect most workloads to be able to put the additional ACEs to good use at the moment. Meanwhile on the back end 290X has that 11% memory bandwidth boost and the 33% increase in L2 cache, which in compute workloads can be largely dedicated to said computational work. On the other hand 290X takes a hit to its double precision floating point (FP64) rate versus 280X, so in double precision scenarios it’s certainly going to enter with a larger handicap.
As always we'll start with our DirectCompute game example, Civilization V, which uses DirectCompute to decompress textures on the fly. Civ V includes a sub-benchmark that exclusively tests the speed of their texture decompression algorithm by repeatedly decompressing the textures required for one of the game’s leader scenes. While DirectCompute is used in many games, this is one of the only games with a benchmark that can isolate the use of DirectCompute and its resulting performance.
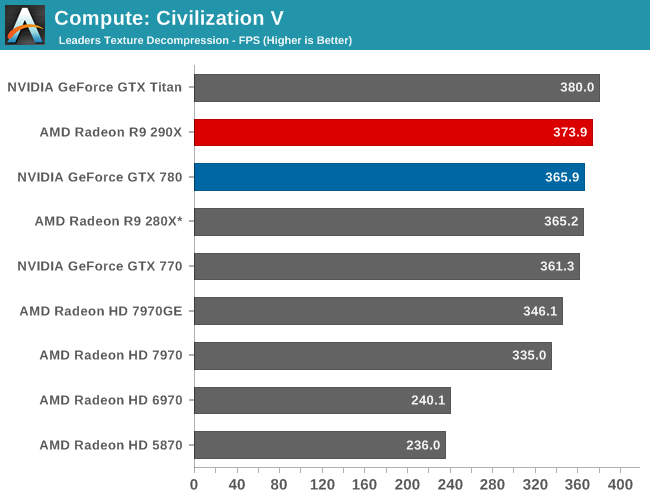
Unfortunately Civ V can’t tell us much of value, due to the fact that we’re running into CPU bottlenecks, not to mention increasingly absurd frame rates. In the 3 years since this game was released high-end CPUs are around 20% faster per core, whereas GPUs are easily 150% faster (if not more). As such the GPU portion of texture decoding has apparently started outpacing the CPU portion, though this is still an enlightening benchmark for anything less than a high-end video card.
For what it is worth, the 290X can edge out the GTX 780 here, only to fall to GTX Titan. But in these CPU limited scenarios the behavior at the very top can be increasingly inconsistent.
Our next benchmark is LuxMark2.0, the official benchmark of SmallLuxGPU 2.0. SmallLuxGPU is an OpenCL accelerated ray tracer that is part of the larger LuxRender suite. Ray tracing has become a stronghold for GPUs in recent years as ray tracing maps well to GPU pipelines, allowing artists to render scenes much more quickly than with CPUs alone.
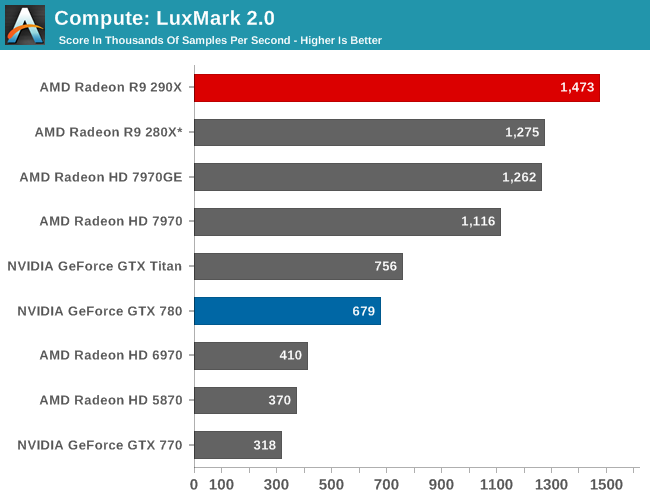
LuxMark by comparison is very simple and very scalable. 290X packs with it a significant increase in computational resources, so 290X picks up from where 280X left off and tops the chart for AMD once more. Titan is barely half as fast here, and GTX 780 falls back even further. Though the fact that scaling from the 280X to 290X is only 16% – a bit less than half of the increase in CUs – is surprising at first glance. Even with the relatively simplistic nature of the benchmark, it has shown signs in the past of craving memory bandwidth and certainly this seems to be one of those times. Feeding those CUs with new rays takes everything the 320GB/sec memory bus of the 290X can deliver, putting a cap on performance gains versus the 280X.
Our 3rd compute benchmark is Sony Vegas Pro 12, an OpenGL and OpenCL video editing and authoring package. Vegas can use GPUs in a few different ways, the primary uses being to accelerate the video effects and compositing process itself, and in the video encoding step. With video encoding being increasingly offloaded to dedicated DSPs these days we’re focusing on the editing and compositing process, rendering to a low CPU overhead format (XDCAM EX). This specific test comes from Sony, and measures how long it takes to render a video.
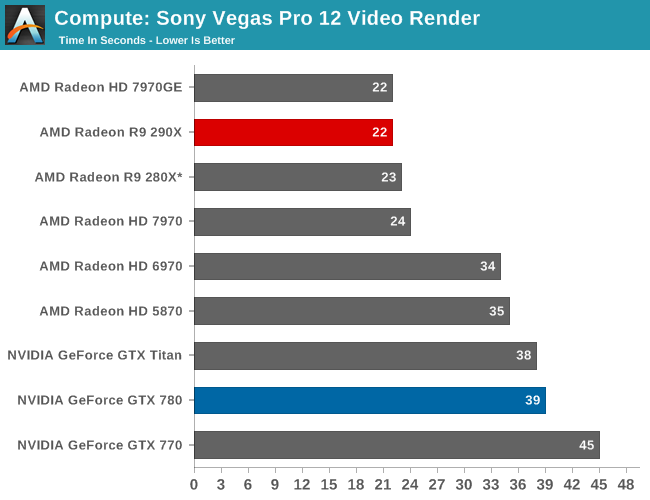
Vegas is another title where GPU performance gains are outpacing CPU performance gains, and as such earlier GPU offloading work has reached its limits and led to the program once again being CPU limited. It’s a shame GPUs have historically underdelivered on video encoding (as opposed to video rendering), as wringing significantly more out of Vegas will require getting rid of the next great CPU bottleneck.
Our 4th benchmark set comes from CLBenchmark 1.1. CLBenchmark contains a number of subtests; we’re focusing on the most practical of them, the computer vision test and the fluid simulation test. The former being a useful proxy for computer imaging tasks where systems are required to parse images and identify features (e.g. humans), while fluid simulations are common in professional graphics work and games alike.
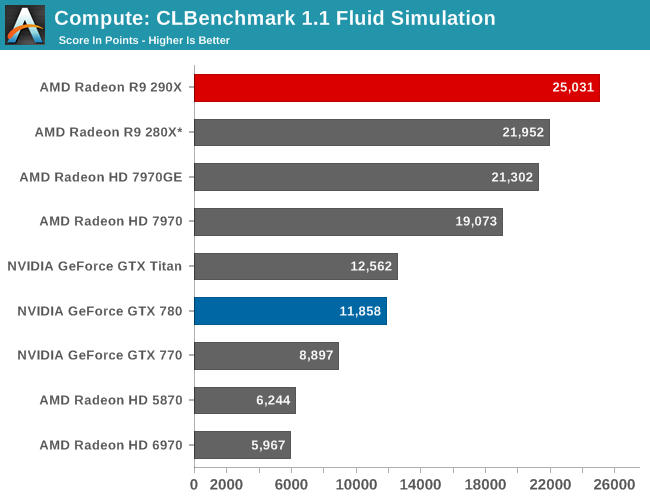
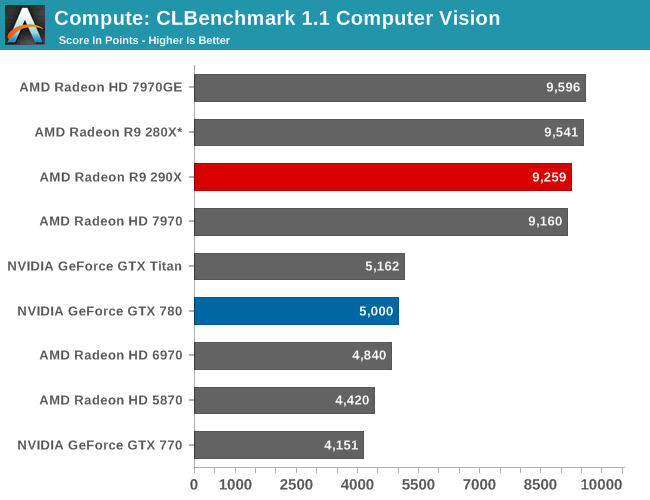
Curiously, the 290X’s performance advantage over 280X is unusual dependent on the specific sub-test. The fluid simulation scales decently enough with the additional CUs, but the computer vision benchmark is stuck in the mud as compared to the 280X. The fluid simulation is certainly closer than the vision benchmark towards being the type of stupidly parallel workload GPUs excel at, though that doesn’t fully explain the lack of scaling in computer vision. If nothing else it’s a good reminder of why professional compute workloads are typically profiled and optimized against specific target hardware, as it reduces these kinds of outcomes in complex, interconnected workloads.
Moving on, our 5th compute benchmark is FAHBench, the official Folding @ Home benchmark. Folding @ Home is the popular Stanford-backed research and distributed computing initiative that has work distributed to millions of volunteer computers over the internet, each of which is responsible for a tiny slice of a protein folding simulation. FAHBench can test both single precision and double precision floating point performance, with single precision being the most useful metric for most consumer cards due to their low double precision performance. Each precision has two modes, explicit and implicit, the difference being whether water atoms are included in the simulation, which adds quite a bit of work and overhead. This is another OpenCL test, as Folding @ Home has moved exclusively to OpenCL this year with FAHCore 17.
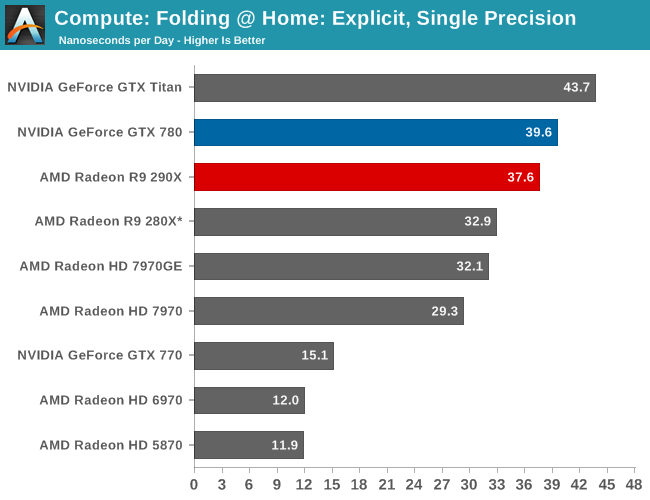
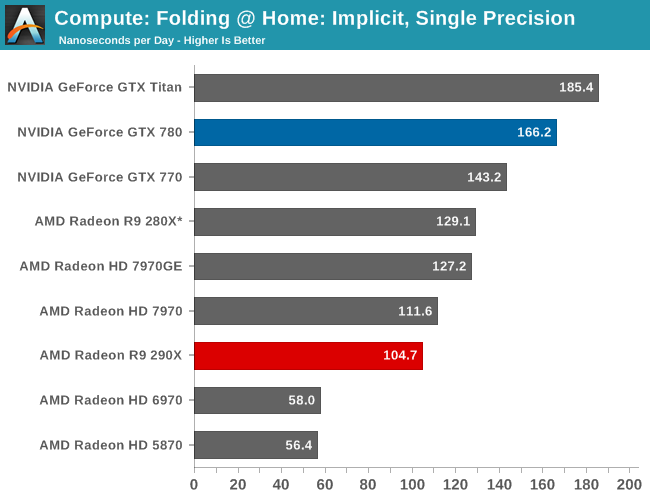
With FAHBench we’re not fully convinced that it knows how to best handle 290X/Hawaii as opposed to 280X/Tahiti. The scaling in single precision explicit is fairly good, but the performance regression in the water-free (and generally more GPU-limited) implicit simulation is unexpected. Consequently while the results are accurate for FAHCore 17, it’s hopefully something AMD and/or the FAH project can work out now that 290X has been released.
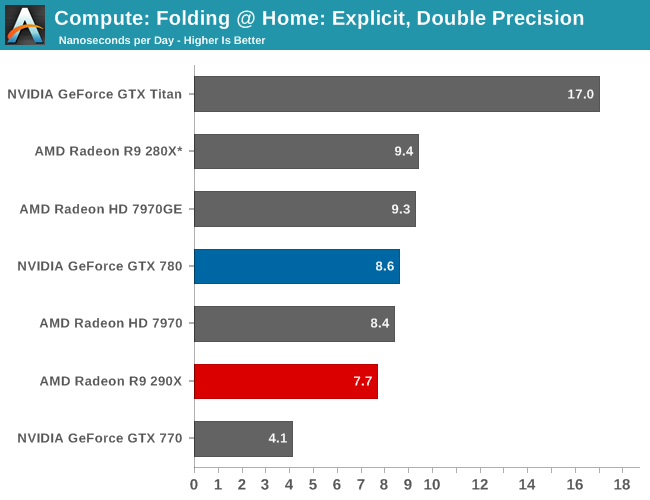
Meanwhile double precision performance also regresses, though here we have a good idea why. With DP performance on 290X being 1/8 FP32 as opposed to ¼ on 280X, this is a benchmark 290X can’t win. Though given the theoretical performance differences we should be expecting between the two video cards – 290X should have about 70% of the FP 64 performance of 280X – the fact that 290X is at 82% bodes well for AMD’s newest GPU. However there’s no getting around the fact that the 290X loses to GTX 780 here even though the GTX 780 is even more harshly capped, which given AMD’s traditional strength in OpenCL compute performance is going to be a let-down.
Wrapping things up, our final compute benchmark is an in-house project developed by our very own Dr. Ian Cutress. SystemCompute is our first C++ AMP benchmark, utilizing Microsoft’s simple C++ extensions to allow the easy use of GPU computing in C++ programs. SystemCompute in turn is a collection of benchmarks for several different fundamental compute algorithms, as described in this previous article, with the final score represented in points. DirectCompute is the compute backend for C++ AMP on Windows, so this forms our other DirectCompute test.
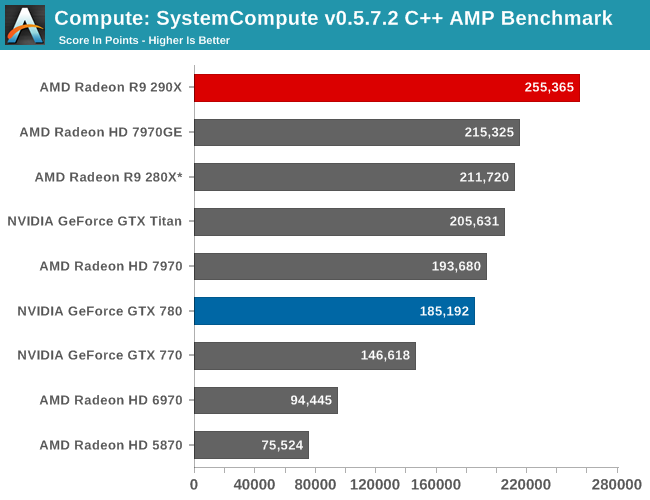
SystemCompute and the underlying C++ AMP environment scales relatively well with the additional CUs offered by 290X. Not only does the 290X easily surpass the GTX Titan and GTX 780 here, but it does so while also beating the 280X by 18%. Or to use AMD’s older GPUs as a point of comparison, we’re up to a 3.4x improvement over 5870, well above the improvement in CU density alone and another reminder of how AMD has really turned things around on the GPU compute side with GCN.


396 Comments
View All Comments
mr_tawan - Tuesday, November 5, 2013 - link
AMD card may suffer from loud cooler. Let's just hope that the OEM versions would be shipped with quieter coolers.1Angelreloaded - Monday, November 11, 2013 - link
I have to be Honest here, it is beast, in fact the only thing in my mind holding this back is lack of feature sets compared to NVidia, namely PhysX, to me this is a bit of a deal breaker compared for 150$ more the 780 Ti gives me that with lower TDP/and sound profile, as we are only able to so much pull from 1 120W breaker without tripping it and modification for some people is a deal breaker due to wear they live and all. Honestly What I really need to see from a site is 4k gaming at max, 1600p/1200p/1080p benchmarks with single cards as well as SLI/Crossfire to see how they scale against each other. To be clear as well a benchmark using Skyrim Modded to the gills in texture resolutions as well to fully see how the VRAM might effect the cards in future games from this next Gen era, where the Consoles can manage a higher texture resolution natively now, and ultimately this will affect PC performance when the standard was 1-2k texture resolutions now becomes double to 4k or even in a select few up to 8k depth. With a native 64 bit architecture as well you will be able to draw more system RAM into the equation where Skyrim can use a max of 3.5 before it dies with Maxwell coming out and a shared memory pool with a single core microprocessor on the die itself with Gsync for smoothness we might see an over engineered GPU card capable of much much more than we thought, ATI as well has their own ideas which will progress, I have a large feeling Hawaii is actually a reject of sorts because they have to compete with Maxwell and engineer more into the cards themselves.marceloviana - Monday, November 25, 2013 - link
I Just wondering why does this card came with 32Gb gddr5 and see only 4Gb. The PCB show 16 Elpida EDW2032BBBG (2G each). This amount of memory will help a lot in large scenes wit Vray-RT.Mat3 - Thursday, March 13, 2014 - link
I don't get it. It's supposed to have 11 compute units per shader engine, making 44 on the entire chip. But the 2nd picture says each shader engine can only have up to 9 compute units....?Mat3 - Thursday, March 13, 2014 - link
2nd picture on page three I mean.sanaris - Monday, April 14, 2014 - link
Who cares? This card was never meant to compute something.It supposed to be "cheap but decent".
Initially they made this ridiculous price, but now it is around 200-350 at ebay.
For $200 it worth its price, because it can be used only to play games.
Who wants to play games at medium quality (not the future ones), may prefer it.