Intel SSD 530 (240GB) Review
by Kristian Vättö on November 15, 2013 1:45 PM EST- Posted in
- Storage
- SSDs
- Intel
- Intel SSD 530
AnandTech Storage Bench 2011
Two years ago we introduced our AnandTech Storage Bench, a suite of benchmarks that took traces of real OS/application usage and played them back in a repeatable manner. Anand assembled the traces out of frustration with the majority of what we have today in terms of SSD benchmarks.
Although the AnandTech Storage Bench tests did a good job of characterizing SSD performance, they weren't stressful enough. All of the tests performed less than 10GB of reads/writes and typically involved only 4GB of writes specifically. That's not even enough exceed the spare area on most SSDs. Most canned SSD benchmarks don't even come close to writing a single gigabyte of data, but that doesn't mean that simply writing 4GB is acceptable.
Originally I kept the benchmarks short enough that they wouldn't be a burden to run (~30 minutes) but long enough that they were representative of what a power user might do with their system.
Not too long ago I tweeted that I had created what I referred to as the Mother of All SSD Benchmarks (MOASB). Rather than only writing 4GB of data to the drive, this benchmark writes 106.32GB. It's the load you'd put on a drive after nearly two weeks of constant usage. And it takes a *long* time to run.
1) The MOASB, officially called AnandTech Storage Bench 2011 - Heavy Workload, mainly focuses on the times when your I/O activity is the highest. There is a lot of downloading and application installing that happens during the course of this test. My thinking was that it's during application installs, file copies, downloading and multitasking with all of this that you can really notice performance differences between drives.
2) I tried to cover as many bases as possible with the software I incorporated into this test. There's a lot of photo editing in Photoshop, HTML editing in Dreamweaver, web browsing, game playing/level loading (Starcraft II & WoW are both a part of the test) as well as general use stuff (application installing, virus scanning). I included a large amount of email downloading, document creation and editing as well. To top it all off I even use Visual Studio 2008 to build Chromium during the test.
The test has 2,168,893 read operations and 1,783,447 write operations. The IO breakdown is as follows:
| AnandTech Storage Bench 2011 - Heavy Workload IO Breakdown | ||||
| IO Size | % of Total | |||
| 4KB | 28% | |||
| 16KB | 10% | |||
| 32KB | 10% | |||
| 64KB | 4% | |||
Only 42% of all operations are sequential, the rest range from pseudo to fully random (with most falling in the pseudo-random category). Average queue depth is 4.625 IOs, with 59% of operations taking place in an IO queue of 1.
Many of you have asked for a better way to really characterize performance. Simply looking at IOPS doesn't really say much. As a result I'm going to be presenting Storage Bench 2011 data in a slightly different way. We'll have performance represented as Average MB/s, with higher numbers being better. At the same time I'll be reporting how long the SSD was busy while running this test. These disk busy graphs will show you exactly how much time was shaved off by using a faster drive vs. a slower one during the course of this test. Finally, I will also break out performance into reads, writes and combined. The reason I do this is to help balance out the fact that this test is unusually write intensive, which can often hide the benefits of a drive with good read performance.
There's also a new light workload for 2011. This is a far more reasonable, typical every day use case benchmark. Lots of web browsing, photo editing (but with a greater focus on photo consumption), video playback as well as some application installs and gaming. This test isn't nearly as write intensive as the MOASB but it's still multiple times more write intensive than what we were running in 2010.
As always I don't believe that these two benchmarks alone are enough to characterize the performance of a drive, but hopefully along with the rest of our tests they will help provide a better idea.
The testbed for Storage Bench 2011 has changed as well. We're now using a Sandy Bridge platform with full 6Gbps support for these tests.
AnandTech Storage Bench 2011 - Heavy Workload
We'll start out by looking at average data rate throughout our new heavy workload test:
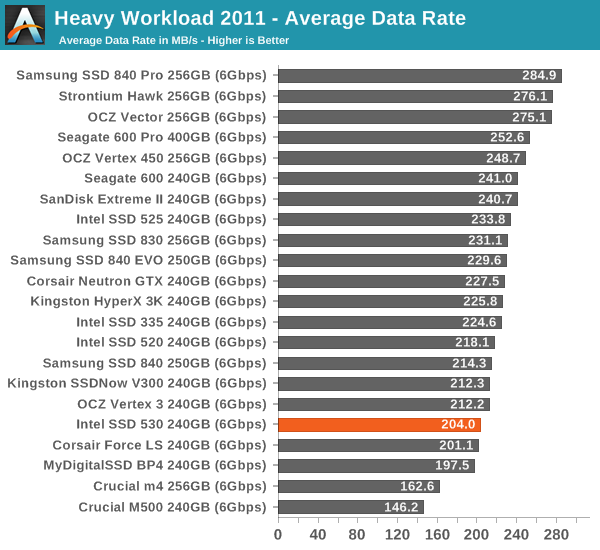
Performance in our 2011 Storage Bench is a bit below the average of SF-2281, although the difference isn't anything to worry about. I decided to include only the most important graphs but you can find the complete dataset in our Bench.
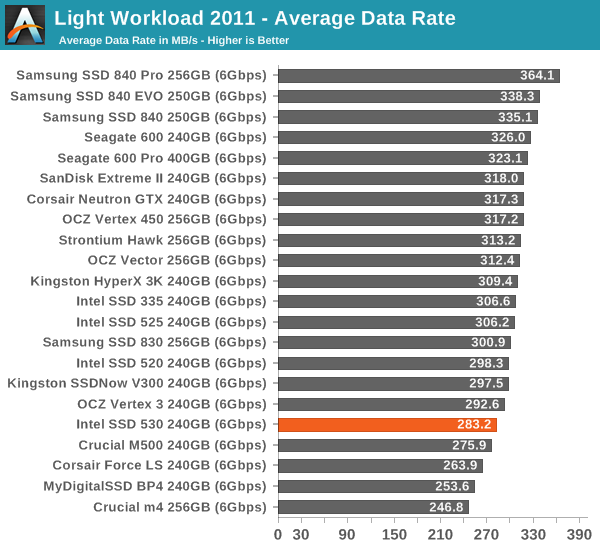
AnandTech Storage Bench 2011 - Light Workload
Our light workload actually has more write operations than read operations. The split is as follows: 372,630 reads and 459,709 writes. The relatively close read/write ratio does better mimic a typical light workload (although even lighter workloads would be far more read centric).
The I/O breakdown is similar to the heavy workload at small IOs, however you'll notice that there are far fewer large IO transfers:
| AnandTech Storage Bench 2011 - Light Workload IO Breakdown | ||||
| IO Size | % of Total | |||
| 4KB | 27% | |||
| 16KB | 8% | |||
| 32KB | 6% | |||
| 64KB | 5% | |||


60 Comments
View All Comments
HisDivineOrder - Saturday, November 16, 2013 - link
Remember when Sandforce used to be desired? That was a long, long time ago. Now they stink of bad firmwares and ugly compromise.jwcalla - Saturday, November 16, 2013 - link
I'm surprised we haven't seen a new gen from them yet. I wonder if they're even working on anything.purerice - Sunday, November 17, 2013 - link
True. It is a better problem to have than great firmware with bad hardware though. I mean, if they have the desire, they can fix existing drives. If they don't, they'll just lose customers, end of story.GuizmoPhil - Sunday, November 17, 2013 - link
The mITX ASUS Maximus VI Impact also got an M2 slot.g00ey - Sunday, November 17, 2013 - link
Sorry but just I don't believe in PCIe as a viable interface for SSD storage. If SATA 6 Gbps turns out to be a bottleneck then make drives that use two SATA channels or more. Or even switch to SAS 12Gbbs which was introduced back in 2011. Not many changes will be needed when switching to SAS since SAS is pin-compatible with SATA and a SAS controller can run SATA drives. The only noticeable difference is that SAS is more stable and cable lengths up to 10 meters (33 feet) are possible whereas only 1 meter (3.3 feet) works for SATA. I also like the SFF-8087/8088 connectors which house 4 SAS/SATA channels in one connector, there is both an internal version (SFF-8087) and an external version (SFF-8088) of this connector, just like SATA vs eSATA.The major advantages of SAS/SATA over PCIe is spelled RAID and hot-swap so it only makes sense to implement PCIe based storage in ultra-portable applications and applications with extremely high demands on low-latency.
tygrus - Sunday, November 17, 2013 - link
How do the SSD's perform with a simultaneous mix of Read/Write ? eg. 70/30 mix of random R/W with Q=32 or simulate tasks that stream read-modify-write.emvonline - Sunday, November 17, 2013 - link
Couple items: The real difference with the 530 is low power options from Sandforce controller and potentially lower cost 20nm NAND. If it isnt cheaper than 520, don't buy it.Intel chose 2281 controller for its consumers SSDs over its internal controller. Why would you recommend that Intel do a consumer SSD with its internal controller? Intels 3500 internal controller is purchased from and fab'd by another company anyway. Do you think the performance it much better than Sandforce 2281 B2?
'nar - Monday, November 18, 2013 - link
I must be dense, because I still don't get why you criticize Sandforce so much about incompressible data. I don't see a need to put incompressible data on an SSD in the first place, so the argument is meaningless.For cost per GB of storage, most people still do not want SSD's holding 500GB of data. Why do they have over 500GB? Pictures, music, movies, ie incompressible data. Therefore, that is stored on a much more cost-effective hard drive and hence, irrelevant here.
I don't see a performance advantage either. What do you do with music and movies? Play them. How much speed does that require? 12MBps? Hard drives are fine for media servers. Maybe you want to copy to a flash drive, but it will be limited itself to about 150MBps for good USB 3 drives anyway. And if you are editing video often then you are likely going over that 20GB per day of writes, so you should put that on an enterprise scratch disk anyway.
So, you ask if Sandforce will "fix" this problem? What problem? It is the fundamental design feature they have. It is what makes them unique, and in "normal" system it is quite useful, reviewers looking for bigger sledge hammers not withstanding. That's like saying the president is not so bad, but maybe if he weren't so black.
You can break anything. These are not build to be indestructible, nobody would be able to afford them if they were. These are built for common use, and I do not see hammering incompressible data in these benchmarks a common use.
Kristian Vättö - Tuesday, November 19, 2013 - link
If you're using software based encryption, it's quite a big deal because all your data will be incompressible. For other SSDs it's the one and same whether the data is compressible or not, but for SandForce based SSDs it's not, so it's a thing worth mentioning. What would be the point of reviews in the first place if we couldn't point out differences and potential design flaws?'nar - Thursday, November 21, 2013 - link
noted. That's it. Not half of all benchmarks. I don't use software encryption for most of my data.