Intel SSD 530 (240GB) Review
by Kristian Vättö on November 15, 2013 1:45 PM EST- Posted in
- Storage
- SSDs
- Intel
- Intel SSD 530
AnandTech Storage Bench 2013
When Anand built the AnandTech Heavy and Light Storage Bench suites in 2011 he did so because we didn't have any good tools at the time that would begin to stress a drive's garbage collection routines. Once all blocks have a sufficient number of used pages, all further writes will inevitably trigger some sort of garbage collection/block recycling algorithm. Our Heavy 2011 test in particular was designed to do just this. By hitting the test SSD with a large enough and write intensive enough workload, we could ensure that some amount of GC would happen.
There were a couple of issues with our 2011 tests that we've been wanting to rectify however. First off, all of our 2011 tests were built using Windows 7 x64 pre-SP1, which meant there were potentially some 4K alignment issues that wouldn't exist had we built the trace on a system with SP1. This didn't really impact most SSDs but it proved to be a problem with some hard drives. Secondly, and more recently, we've shifted focus from simply triggering GC routines to really looking at worst-case scenario performance after prolonged random IO.
For years we'd felt the negative impacts of inconsistent IO performance with all SSDs, but until the S3700 showed up we didn't think to actually measure and visualize IO consistency. The problem with our IO consistency tests is that they are very focused on 4KB random writes at high queue depths and full LBA spans–not exactly a real world client usage model. The aspects of SSD architecture that those tests stress however are very important, and none of our existing tests were doing a good job of quantifying that.
We needed an updated heavy test, one that dealt with an even larger set of data and one that somehow incorporated IO consistency into its metrics. We think we have that test. The new benchmark doesn't even have a name, we've just been calling it The Destroyer (although AnandTech Storage Bench 2013 is likely a better fit for PR reasons).
Everything about this new test is bigger and better. The test platform moves to Windows 8 Pro x64. The workload is far more realistic. Just as before, this is an application trace based test–we record all IO requests made to a test system, then play them back on the drive we're measuring and run statistical analysis on the drive's responses.
Imitating most modern benchmarks Anand crafted the Destroyer out of a series of scenarios. For this benchmark we focused heavily on Photo editing, Gaming, Virtualization, General Productivity, Video Playback and Application Development. Rough descriptions of the various scenarios are in the table below:
| AnandTech Storage Bench 2013 Preview - The Destroyer | ||||||||||||
| Workload | Description | Applications Used | ||||||||||
| Photo Sync/Editing | Import images, edit, export | Adobe Photoshop CS6, Adobe Lightroom 4, Dropbox | ||||||||||
| Gaming | Download/install games, play games | Steam, Deus Ex, Skyrim, Starcraft 2, BioShock Infinite | ||||||||||
| Virtualization | Run/manage VM, use general apps inside VM | VirtualBox | ||||||||||
| General Productivity | Browse the web, manage local email, copy files, encrypt/decrypt files, backup system, download content, virus/malware scan | Chrome, IE10, Outlook, Windows 8, AxCrypt, uTorrent, AdAware | ||||||||||
| Video Playback | Copy and watch movies | Windows 8 | ||||||||||
| Application Development | Compile projects, check out code, download code samples | Visual Studio 2012 | ||||||||||
While some tasks remained independent, many were stitched together (e.g. system backups would take place while other scenarios were taking place). The overall stats give some justification to what we've been calling this test internally:
| AnandTech Storage Bench 2013 Preview - The Destroyer, Specs | |||||||||||||
| The Destroyer (2013) | Heavy 2011 | ||||||||||||
| Reads | 38.83 million | 2.17 million | |||||||||||
| Writes | 10.98 million | 1.78 million | |||||||||||
| Total IO Operations | 49.8 million | 3.99 million | |||||||||||
| Total GB Read | 1583.02 GB | 48.63 GB | |||||||||||
| Total GB Written | 875.62 GB | 106.32 GB | |||||||||||
| Average Queue Depth | ~5.5 | ~4.6 | |||||||||||
| Focus | Worst-case multitasking, IO consistency | Peak IO, basic GC routines | |||||||||||
SSDs have grown in their performance abilities over the years, so we wanted a new test that could really push high queue depths at times. The average queue depth is still realistic for a client workload, but the Destroyer has some very demanding peaks. When we first introduced the Heavy 2011 test, some drives would take multiple hours to complete it; today most high performance SSDs can finish the test in under 90 minutes. The Destroyer? So far the fastest we've seen it go is 10 hours. Most high performance SSDs we've tested seem to need around 12–13 hours per run, with mainstream drives taking closer to 24 hours. The read/write balance is also a lot more realistic than in the Heavy 2011 test. Back in 2011 we just needed something that had a ton of writes so we could start separating the good from the bad. Now that the drives have matured, we felt a test that was a bit more balanced would be a better idea.
Despite the balance recalibration, there's just a ton of data moving around in this test. Ultimately the sheer volume of data here and the fact that there's a good amount of random IO courtesy of all of the multitasking (e.g. background VM work, background photo exports/syncs, etc...) makes the Destroyer do a far better job of giving credit for performance consistency than the old Heavy 2011 test. Both tests are valid; they just stress/showcase different things. As the days of begging for better random IO performance and basic GC intelligence are over, we wanted a test that would give us a bit more of what we're interested in these days. As Anand mentioned in the S3700 review, having good worst-case IO performance and consistency matters just as much to client users as it does to enterprise users.
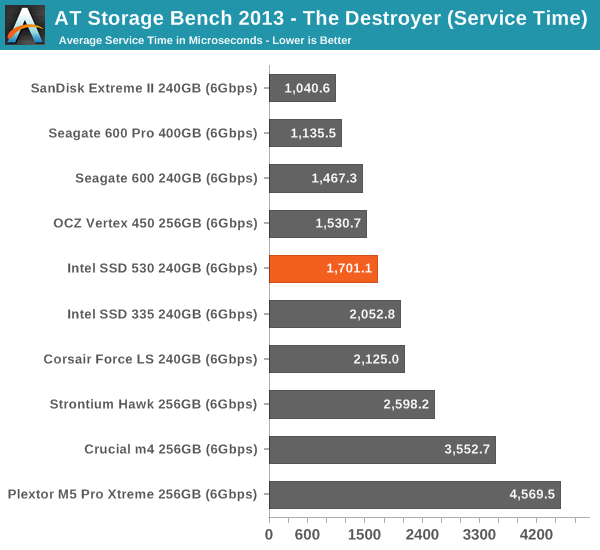
We're reporting two primary metrics with the Destroyer: average data rate in MB/s and average service time in microseconds. The former gives you an idea of the throughput of the drive during the time that it was running the Destroyer workload. This can be a very good indication of overall performance. What average data rate doesn't do a good job of is taking into account response time of very bursty (read: high queue depth) IO. By reporting average service time we heavily weigh latency for queued IOs. You'll note that this is a metric we've been reporting in our enterprise benchmarks for a while now. With the client tests maturing, the time was right for a little convergence.
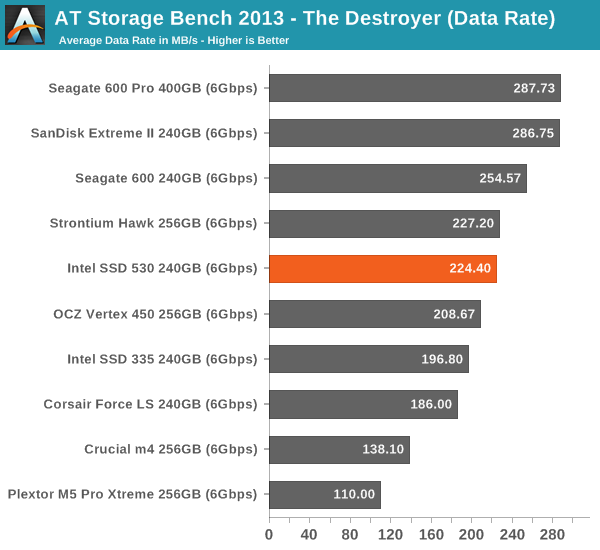
The SSD 530 does okay in our new Storage Bench 2013. The improvement from SSD 335 is again quite significant, which is mostly thanks to the improved performance consistency. However, the SF-2281 simply can't challenge the more modern designs and for ultimate performance the SanDisk Extreme II is still the best pick.


60 Comments
View All Comments
HisDivineOrder - Saturday, November 16, 2013 - link
Remember when Sandforce used to be desired? That was a long, long time ago. Now they stink of bad firmwares and ugly compromise.jwcalla - Saturday, November 16, 2013 - link
I'm surprised we haven't seen a new gen from them yet. I wonder if they're even working on anything.purerice - Sunday, November 17, 2013 - link
True. It is a better problem to have than great firmware with bad hardware though. I mean, if they have the desire, they can fix existing drives. If they don't, they'll just lose customers, end of story.GuizmoPhil - Sunday, November 17, 2013 - link
The mITX ASUS Maximus VI Impact also got an M2 slot.g00ey - Sunday, November 17, 2013 - link
Sorry but just I don't believe in PCIe as a viable interface for SSD storage. If SATA 6 Gbps turns out to be a bottleneck then make drives that use two SATA channels or more. Or even switch to SAS 12Gbbs which was introduced back in 2011. Not many changes will be needed when switching to SAS since SAS is pin-compatible with SATA and a SAS controller can run SATA drives. The only noticeable difference is that SAS is more stable and cable lengths up to 10 meters (33 feet) are possible whereas only 1 meter (3.3 feet) works for SATA. I also like the SFF-8087/8088 connectors which house 4 SAS/SATA channels in one connector, there is both an internal version (SFF-8087) and an external version (SFF-8088) of this connector, just like SATA vs eSATA.The major advantages of SAS/SATA over PCIe is spelled RAID and hot-swap so it only makes sense to implement PCIe based storage in ultra-portable applications and applications with extremely high demands on low-latency.
tygrus - Sunday, November 17, 2013 - link
How do the SSD's perform with a simultaneous mix of Read/Write ? eg. 70/30 mix of random R/W with Q=32 or simulate tasks that stream read-modify-write.emvonline - Sunday, November 17, 2013 - link
Couple items: The real difference with the 530 is low power options from Sandforce controller and potentially lower cost 20nm NAND. If it isnt cheaper than 520, don't buy it.Intel chose 2281 controller for its consumers SSDs over its internal controller. Why would you recommend that Intel do a consumer SSD with its internal controller? Intels 3500 internal controller is purchased from and fab'd by another company anyway. Do you think the performance it much better than Sandforce 2281 B2?
'nar - Monday, November 18, 2013 - link
I must be dense, because I still don't get why you criticize Sandforce so much about incompressible data. I don't see a need to put incompressible data on an SSD in the first place, so the argument is meaningless.For cost per GB of storage, most people still do not want SSD's holding 500GB of data. Why do they have over 500GB? Pictures, music, movies, ie incompressible data. Therefore, that is stored on a much more cost-effective hard drive and hence, irrelevant here.
I don't see a performance advantage either. What do you do with music and movies? Play them. How much speed does that require? 12MBps? Hard drives are fine for media servers. Maybe you want to copy to a flash drive, but it will be limited itself to about 150MBps for good USB 3 drives anyway. And if you are editing video often then you are likely going over that 20GB per day of writes, so you should put that on an enterprise scratch disk anyway.
So, you ask if Sandforce will "fix" this problem? What problem? It is the fundamental design feature they have. It is what makes them unique, and in "normal" system it is quite useful, reviewers looking for bigger sledge hammers not withstanding. That's like saying the president is not so bad, but maybe if he weren't so black.
You can break anything. These are not build to be indestructible, nobody would be able to afford them if they were. These are built for common use, and I do not see hammering incompressible data in these benchmarks a common use.
Kristian Vättö - Tuesday, November 19, 2013 - link
If you're using software based encryption, it's quite a big deal because all your data will be incompressible. For other SSDs it's the one and same whether the data is compressible or not, but for SandForce based SSDs it's not, so it's a thing worth mentioning. What would be the point of reviews in the first place if we couldn't point out differences and potential design flaws?'nar - Thursday, November 21, 2013 - link
noted. That's it. Not half of all benchmarks. I don't use software encryption for most of my data.