Intel SSD 530 (240GB) Review
by Kristian Vättö on November 15, 2013 1:45 PM EST- Posted in
- Storage
- SSDs
- Intel
- Intel SSD 530
AnandTech Storage Bench 2013
When Anand built the AnandTech Heavy and Light Storage Bench suites in 2011 he did so because we didn't have any good tools at the time that would begin to stress a drive's garbage collection routines. Once all blocks have a sufficient number of used pages, all further writes will inevitably trigger some sort of garbage collection/block recycling algorithm. Our Heavy 2011 test in particular was designed to do just this. By hitting the test SSD with a large enough and write intensive enough workload, we could ensure that some amount of GC would happen.
There were a couple of issues with our 2011 tests that we've been wanting to rectify however. First off, all of our 2011 tests were built using Windows 7 x64 pre-SP1, which meant there were potentially some 4K alignment issues that wouldn't exist had we built the trace on a system with SP1. This didn't really impact most SSDs but it proved to be a problem with some hard drives. Secondly, and more recently, we've shifted focus from simply triggering GC routines to really looking at worst-case scenario performance after prolonged random IO.
For years we'd felt the negative impacts of inconsistent IO performance with all SSDs, but until the S3700 showed up we didn't think to actually measure and visualize IO consistency. The problem with our IO consistency tests is that they are very focused on 4KB random writes at high queue depths and full LBA spans–not exactly a real world client usage model. The aspects of SSD architecture that those tests stress however are very important, and none of our existing tests were doing a good job of quantifying that.
We needed an updated heavy test, one that dealt with an even larger set of data and one that somehow incorporated IO consistency into its metrics. We think we have that test. The new benchmark doesn't even have a name, we've just been calling it The Destroyer (although AnandTech Storage Bench 2013 is likely a better fit for PR reasons).
Everything about this new test is bigger and better. The test platform moves to Windows 8 Pro x64. The workload is far more realistic. Just as before, this is an application trace based test–we record all IO requests made to a test system, then play them back on the drive we're measuring and run statistical analysis on the drive's responses.
Imitating most modern benchmarks Anand crafted the Destroyer out of a series of scenarios. For this benchmark we focused heavily on Photo editing, Gaming, Virtualization, General Productivity, Video Playback and Application Development. Rough descriptions of the various scenarios are in the table below:
| AnandTech Storage Bench 2013 Preview - The Destroyer | ||||||||||||
| Workload | Description | Applications Used | ||||||||||
| Photo Sync/Editing | Import images, edit, export | Adobe Photoshop CS6, Adobe Lightroom 4, Dropbox | ||||||||||
| Gaming | Download/install games, play games | Steam, Deus Ex, Skyrim, Starcraft 2, BioShock Infinite | ||||||||||
| Virtualization | Run/manage VM, use general apps inside VM | VirtualBox | ||||||||||
| General Productivity | Browse the web, manage local email, copy files, encrypt/decrypt files, backup system, download content, virus/malware scan | Chrome, IE10, Outlook, Windows 8, AxCrypt, uTorrent, AdAware | ||||||||||
| Video Playback | Copy and watch movies | Windows 8 | ||||||||||
| Application Development | Compile projects, check out code, download code samples | Visual Studio 2012 | ||||||||||
While some tasks remained independent, many were stitched together (e.g. system backups would take place while other scenarios were taking place). The overall stats give some justification to what we've been calling this test internally:
| AnandTech Storage Bench 2013 Preview - The Destroyer, Specs | |||||||||||||
| The Destroyer (2013) | Heavy 2011 | ||||||||||||
| Reads | 38.83 million | 2.17 million | |||||||||||
| Writes | 10.98 million | 1.78 million | |||||||||||
| Total IO Operations | 49.8 million | 3.99 million | |||||||||||
| Total GB Read | 1583.02 GB | 48.63 GB | |||||||||||
| Total GB Written | 875.62 GB | 106.32 GB | |||||||||||
| Average Queue Depth | ~5.5 | ~4.6 | |||||||||||
| Focus | Worst-case multitasking, IO consistency | Peak IO, basic GC routines | |||||||||||
SSDs have grown in their performance abilities over the years, so we wanted a new test that could really push high queue depths at times. The average queue depth is still realistic for a client workload, but the Destroyer has some very demanding peaks. When we first introduced the Heavy 2011 test, some drives would take multiple hours to complete it; today most high performance SSDs can finish the test in under 90 minutes. The Destroyer? So far the fastest we've seen it go is 10 hours. Most high performance SSDs we've tested seem to need around 12–13 hours per run, with mainstream drives taking closer to 24 hours. The read/write balance is also a lot more realistic than in the Heavy 2011 test. Back in 2011 we just needed something that had a ton of writes so we could start separating the good from the bad. Now that the drives have matured, we felt a test that was a bit more balanced would be a better idea.
Despite the balance recalibration, there's just a ton of data moving around in this test. Ultimately the sheer volume of data here and the fact that there's a good amount of random IO courtesy of all of the multitasking (e.g. background VM work, background photo exports/syncs, etc...) makes the Destroyer do a far better job of giving credit for performance consistency than the old Heavy 2011 test. Both tests are valid; they just stress/showcase different things. As the days of begging for better random IO performance and basic GC intelligence are over, we wanted a test that would give us a bit more of what we're interested in these days. As Anand mentioned in the S3700 review, having good worst-case IO performance and consistency matters just as much to client users as it does to enterprise users.
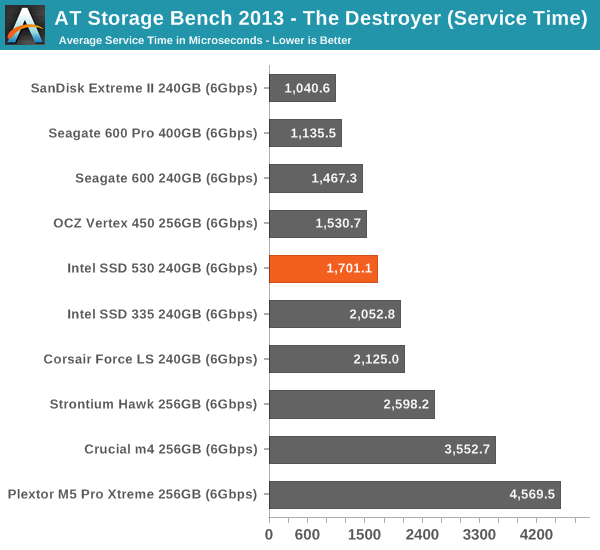
We're reporting two primary metrics with the Destroyer: average data rate in MB/s and average service time in microseconds. The former gives you an idea of the throughput of the drive during the time that it was running the Destroyer workload. This can be a very good indication of overall performance. What average data rate doesn't do a good job of is taking into account response time of very bursty (read: high queue depth) IO. By reporting average service time we heavily weigh latency for queued IOs. You'll note that this is a metric we've been reporting in our enterprise benchmarks for a while now. With the client tests maturing, the time was right for a little convergence.
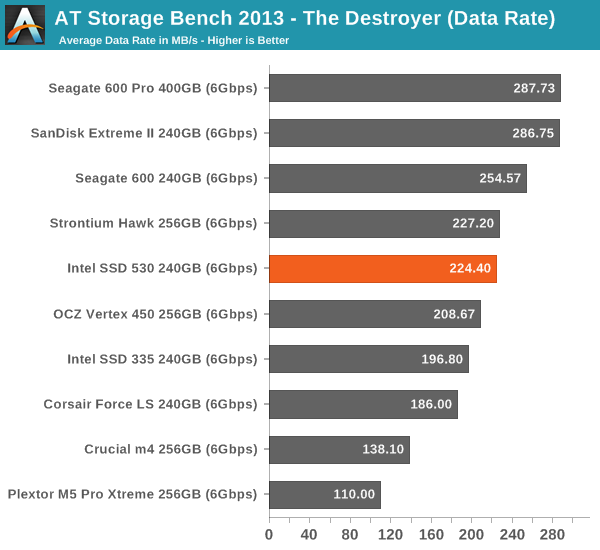
The SSD 530 does okay in our new Storage Bench 2013. The improvement from SSD 335 is again quite significant, which is mostly thanks to the improved performance consistency. However, the SF-2281 simply can't challenge the more modern designs and for ultimate performance the SanDisk Extreme II is still the best pick.


60 Comments
View All Comments
Magichands8 - Friday, November 15, 2013 - link
"It will be interesting to see what Intel's approach will be with SATA Express..."Apparently Intel's approach is to ignore it as SATA Express won't be a part of Intel's 9-series chipset to be released next year. So God knows when we'll have any reasonable access to it. It seems that the only place left for SSD makers to go in order to differentiate their products is to reduce price/increase capacity. And when SSDs finally start hitting 2+ TB per device at reasonable prices our only option will be to resort to RAID 0 to get around the SATA albatross hanging around our necks.
Hrel - Friday, November 15, 2013 - link
The Seagate 600 and Crucial M500 outperform the Intel drive and are a whopping $50 less. I see no value gained for paying more than $150 for a 256GB SSD. Am I missing something or is every 256GB drive over $150 as bad a deal as I think?Laststop311 - Sunday, November 17, 2013 - link
Samsung 840 pro is worth every penny. Not only does it consistently fall in the top 3 for sequential reads and random reads it also falls in the top 3 for lowest power used. It is the only ssd on the market to perform that high while using that low of wattage. It's something special and has reigned supreme the entire 14ish months it's been out.You really need to look for deals on it though. Like newegg is selling the 512GB for 480 but I went on ebay and found a brand new sealed in box for 389.00 free shipping and no tax. 480 is a lot of omney for a 512GB but for 389 at that deal how can you buy any other 500GB capacity drive. Also these samsung drives perform noticeably at their very best if you leave 20% of it untouched so out of the 512GB you really should leave 102GB free and just use 410GB. Thats why you should buy 1 capacity size over what you need so you can properly over provision and have maximum iops at all times.
I transfered a 200GB file from a 750GB samsung evo ssd to the 512GB 840 pro in a few seconds under 7 minutes. Thats pretty insane speed 200GB in less then 7 mins. Thats basically sata III being saturated. And it's saturates it while using the lowest power of ssd's in similiar situations.
So yes 240 dollars is a lot for 256GB but I have seen them go on sale for 190 and you can search ebay too. Don't settle for a cheap ssd with poor power efficiency and slower speeds.
purerice - Sunday, November 17, 2013 - link
I'm in the same boat you are. Seagate seemed to be near the top in most categories and used less power (perhaps over more time?) than Samsung 840 Pro and Intel... yet for a lot less money.For me especially, I'm still running on a 7200rpm drive for 90% of my work. The other 10% is 5400rpm. Even the slowest of these drives so so insanely faster than what I have that the marginal difference of anything above the Seagate gets lost in the wash.
MikeMurphy - Friday, January 10, 2014 - link
This isn't a top drive, but it offers good performance, all-important low idle power consumption, access to the extremely helpful Intel SSD Toolbox, Intel reliability and a 5-year warranty.I'm happy to spend a couple extra bucks for this feature set.
supax - Friday, November 15, 2013 - link
I actually just picked up a Seagate 600 240GB for $130 after $20 MIR. Seemed like a better deal to me anyway.jwcalla - Friday, November 15, 2013 - link
So is it confirmed that SF-22xx series drives work on Haswell chipsets? Is it only the SF-12xx series that doesn't work or is it still a mixed bag of guesswork?iwod - Friday, November 15, 2013 - link
I was just discussing this earlier. Since Intel decided to ditch the SATA Express, may be we are moving straight to PCI-E Native instead? The thing is we already have PCI-E Native SSD from Apple in many of its consumer Mac already already using it. And the trend will likely continue in next year. Since we are not going to get SATA Express until late next year with the original Intel 9 series chipset. Intel thought it may have been too late anyway and ditch it instead?Kristian Vättö - Sunday, November 17, 2013 - link
SATA Express is PCIe. SATA Express is simply the name of the connector which combines SATA and PCIe into one (i.e. the same connector works with SATA and PCIe devices).http://www.anandtech.com/show/6294/breaking-the-sa...
Morawka - Saturday, November 16, 2013 - link
The biggest fail of the year is when Asus put the M.2 Connector on a PCI 1.0 Bus. GG ASUS are you retarded?