Intel SSD 530 (240GB) Review
by Kristian Vättö on November 15, 2013 1:45 PM EST- Posted in
- Storage
- SSDs
- Intel
- Intel SSD 530
AnandTech Storage Bench 2013
When Anand built the AnandTech Heavy and Light Storage Bench suites in 2011 he did so because we didn't have any good tools at the time that would begin to stress a drive's garbage collection routines. Once all blocks have a sufficient number of used pages, all further writes will inevitably trigger some sort of garbage collection/block recycling algorithm. Our Heavy 2011 test in particular was designed to do just this. By hitting the test SSD with a large enough and write intensive enough workload, we could ensure that some amount of GC would happen.
There were a couple of issues with our 2011 tests that we've been wanting to rectify however. First off, all of our 2011 tests were built using Windows 7 x64 pre-SP1, which meant there were potentially some 4K alignment issues that wouldn't exist had we built the trace on a system with SP1. This didn't really impact most SSDs but it proved to be a problem with some hard drives. Secondly, and more recently, we've shifted focus from simply triggering GC routines to really looking at worst-case scenario performance after prolonged random IO.
For years we'd felt the negative impacts of inconsistent IO performance with all SSDs, but until the S3700 showed up we didn't think to actually measure and visualize IO consistency. The problem with our IO consistency tests is that they are very focused on 4KB random writes at high queue depths and full LBA spans–not exactly a real world client usage model. The aspects of SSD architecture that those tests stress however are very important, and none of our existing tests were doing a good job of quantifying that.
We needed an updated heavy test, one that dealt with an even larger set of data and one that somehow incorporated IO consistency into its metrics. We think we have that test. The new benchmark doesn't even have a name, we've just been calling it The Destroyer (although AnandTech Storage Bench 2013 is likely a better fit for PR reasons).
Everything about this new test is bigger and better. The test platform moves to Windows 8 Pro x64. The workload is far more realistic. Just as before, this is an application trace based test–we record all IO requests made to a test system, then play them back on the drive we're measuring and run statistical analysis on the drive's responses.
Imitating most modern benchmarks Anand crafted the Destroyer out of a series of scenarios. For this benchmark we focused heavily on Photo editing, Gaming, Virtualization, General Productivity, Video Playback and Application Development. Rough descriptions of the various scenarios are in the table below:
| AnandTech Storage Bench 2013 Preview - The Destroyer | ||||||||||||
| Workload | Description | Applications Used | ||||||||||
| Photo Sync/Editing | Import images, edit, export | Adobe Photoshop CS6, Adobe Lightroom 4, Dropbox | ||||||||||
| Gaming | Download/install games, play games | Steam, Deus Ex, Skyrim, Starcraft 2, BioShock Infinite | ||||||||||
| Virtualization | Run/manage VM, use general apps inside VM | VirtualBox | ||||||||||
| General Productivity | Browse the web, manage local email, copy files, encrypt/decrypt files, backup system, download content, virus/malware scan | Chrome, IE10, Outlook, Windows 8, AxCrypt, uTorrent, AdAware | ||||||||||
| Video Playback | Copy and watch movies | Windows 8 | ||||||||||
| Application Development | Compile projects, check out code, download code samples | Visual Studio 2012 | ||||||||||
While some tasks remained independent, many were stitched together (e.g. system backups would take place while other scenarios were taking place). The overall stats give some justification to what we've been calling this test internally:
| AnandTech Storage Bench 2013 Preview - The Destroyer, Specs | |||||||||||||
| The Destroyer (2013) | Heavy 2011 | ||||||||||||
| Reads | 38.83 million | 2.17 million | |||||||||||
| Writes | 10.98 million | 1.78 million | |||||||||||
| Total IO Operations | 49.8 million | 3.99 million | |||||||||||
| Total GB Read | 1583.02 GB | 48.63 GB | |||||||||||
| Total GB Written | 875.62 GB | 106.32 GB | |||||||||||
| Average Queue Depth | ~5.5 | ~4.6 | |||||||||||
| Focus | Worst-case multitasking, IO consistency | Peak IO, basic GC routines | |||||||||||
SSDs have grown in their performance abilities over the years, so we wanted a new test that could really push high queue depths at times. The average queue depth is still realistic for a client workload, but the Destroyer has some very demanding peaks. When we first introduced the Heavy 2011 test, some drives would take multiple hours to complete it; today most high performance SSDs can finish the test in under 90 minutes. The Destroyer? So far the fastest we've seen it go is 10 hours. Most high performance SSDs we've tested seem to need around 12–13 hours per run, with mainstream drives taking closer to 24 hours. The read/write balance is also a lot more realistic than in the Heavy 2011 test. Back in 2011 we just needed something that had a ton of writes so we could start separating the good from the bad. Now that the drives have matured, we felt a test that was a bit more balanced would be a better idea.
Despite the balance recalibration, there's just a ton of data moving around in this test. Ultimately the sheer volume of data here and the fact that there's a good amount of random IO courtesy of all of the multitasking (e.g. background VM work, background photo exports/syncs, etc...) makes the Destroyer do a far better job of giving credit for performance consistency than the old Heavy 2011 test. Both tests are valid; they just stress/showcase different things. As the days of begging for better random IO performance and basic GC intelligence are over, we wanted a test that would give us a bit more of what we're interested in these days. As Anand mentioned in the S3700 review, having good worst-case IO performance and consistency matters just as much to client users as it does to enterprise users.
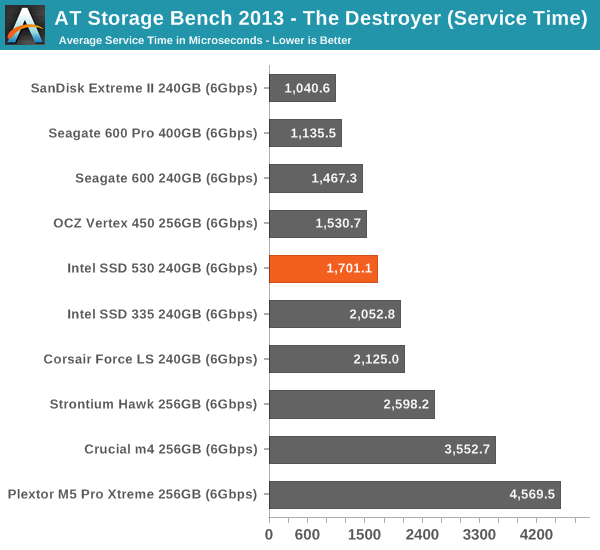
We're reporting two primary metrics with the Destroyer: average data rate in MB/s and average service time in microseconds. The former gives you an idea of the throughput of the drive during the time that it was running the Destroyer workload. This can be a very good indication of overall performance. What average data rate doesn't do a good job of is taking into account response time of very bursty (read: high queue depth) IO. By reporting average service time we heavily weigh latency for queued IOs. You'll note that this is a metric we've been reporting in our enterprise benchmarks for a while now. With the client tests maturing, the time was right for a little convergence.
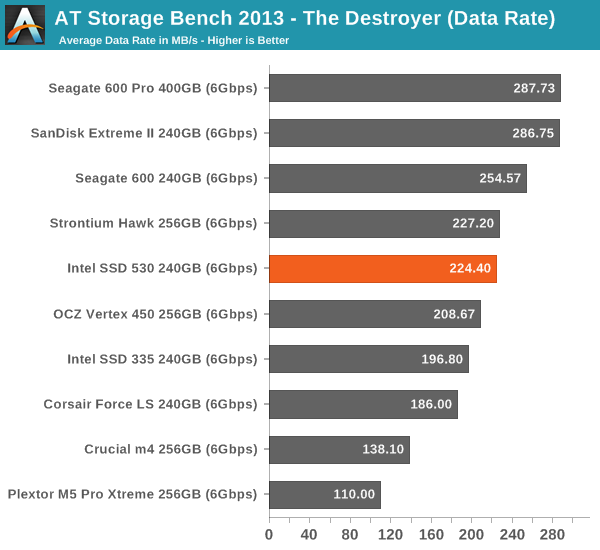
The SSD 530 does okay in our new Storage Bench 2013. The improvement from SSD 335 is again quite significant, which is mostly thanks to the improved performance consistency. However, the SF-2281 simply can't challenge the more modern designs and for ultimate performance the SanDisk Extreme II is still the best pick.


60 Comments
View All Comments
dynamited - Friday, November 15, 2013 - link
I count seven asus motherboards with mPCIE, not one, at newegg. Regarding 6bps sata saturated, just run with RAID 0, is that hard to figure out how to do?ExodusC - Friday, November 15, 2013 - link
I don't think TRIM commands can be passed through to SSDs running in RAID 0. At one point the Intel storage drivers supported this, but I heard that this had been pulled. I can't find any documentation on this.Additionally, even though SSDs are fairly reliable, adding another drive simply adds another point for failure.
Wetworkz - Friday, November 15, 2013 - link
You CAN pass TRIM commands through to SSDs running in Raid 0 on Intel hardware. It has NOT been pulled. You need to have the latest Intel Toolbox in combination with the latest RST drivers installed. I just TRIMMED both my arrays a couple days ago.ExodusC - Friday, November 15, 2013 - link
Out of curiosity, is that an automated process, or does it require manual TRIM through the Intel SSD Toolbox? What RAID levels are supported?I also wonder about the compressibility of striped data and if there is any effect there.
Samus - Friday, November 15, 2013 - link
I pass TRIM to my RAID 0 Samsung 840 RAID through the Windows 8 defrag on my H87 chipset. Performance tests prove it works. Unfortunately if I have the IRST software installed the drives are downgraded to SATA 3Gbps. I tried different cables and everything. Uninstalling the IRST software after making the RAID 0 restores them to 6Gbps...DMCalloway - Friday, November 15, 2013 - link
It was my understanding that TRIM worked in RAID 0 with the newer RST drivers, but only on Intel 7 series chipsets and newer. I do like Intel products but this is one thing they shafted us on.Wetworkz - Saturday, November 16, 2013 - link
I just TRIMMED both my arrays a few days ago and one array was on an Intel 6 series chipset. I know that series 6 was not previously supported but I was able to initiate TRIM on the array with the newest Intel Toolbox and the newest RST drivers for the first time the other day. I cannot confirm this is officially supported behavior but I was able to do it with the newest drivers. I would give it a try if you have a series 6 board.'nar - Monday, November 18, 2013 - link
I don't really care about TRIM. Garbage Collection works better anyway, especially on SandForce drives.extide - Friday, November 15, 2013 - link
mPCIE is not the same as M.2dynamited - Friday, November 15, 2013 - link
I believe they are calling it "mPCIe Combo Card" which actually has two connects to one on the motherboard.