Memory Scaling on Haswell CPU, IGP and dGPU: DDR3-1333 to DDR3-3000 Tested with G.Skill
by Ian Cutress on September 26, 2013 4:00 PM ESTAs mentioned previously, real world testing is where users should be feeling the benefits of spending up to 13x on memory, rather than a synthetic test. A synthetic test exacerbates a specific type of loading to get peak results in terms of memory read/write and latency timings, most of which are not indicative of the pseudo random nature of real-world workloads (opening email, applying logic). There are several situations which might fall under the typical scrutiny of a real world loading, such as video conversion/video editing. It is at this point we consider if the CPU caches are too small and the system is relying on frequent memory accesses because the CPU cannot be fed with enough data. It is these circumstances where memory speed is important, and it is all down to how the video converter is programmed rather than just a carte blanche on all video converters benefitting from memory. As we will see in the IGP Compute section of this review, anything that can leverage the IGP cores can be a ripe candidate for increased memory speed.
Our tests in the CPU Real World section come from our motherboard reviews in order to emulate potential scenarios that a user may encounter.
USB 3.0 Copy Test with MaxCPU
We transfer a set size of files from the 120GB OCZ Vertex3 connected via SATA 6 Gbps on the motherboard to the 240 GB OCZ Vertex3 SSD with a SATA 6 Gbps to USB 3.0 converter via USB 3.0 using DiskBench, which monitors the time taken to transfer. The files transferred are a 9.2 GB set of 7539 files across 1011 folders – 95% of these files are small typical website files, and the rest (90% of the size) are precompiled installers. In an update to pre-Z87 testing, we also run MaxCPU to load up one of the threads during the test which improves general performance up to 15% by causing all the internal pathways to run at full speed.
Results are represented as seconds taken to complete the copy test, where lower is better.
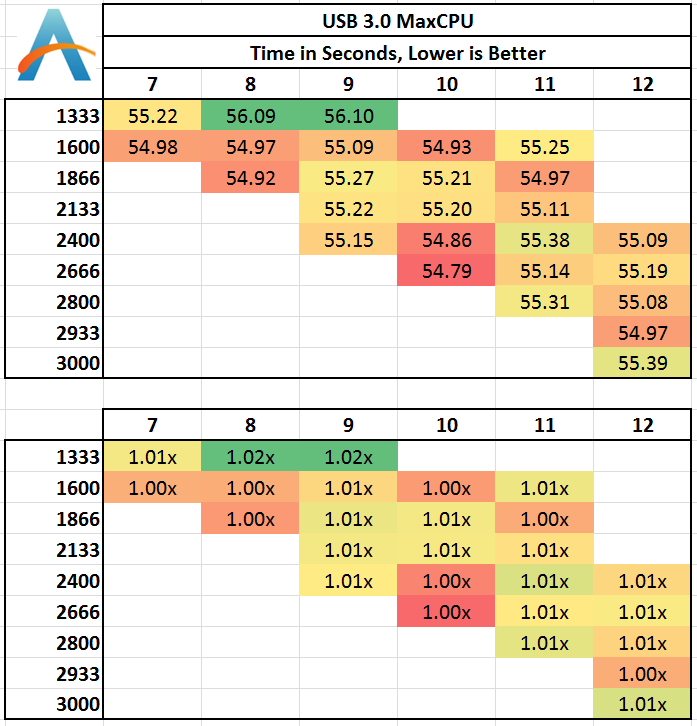
The difference between the slowest and the fastest is around 2%, or 1 second in our test, making the memory have little influence over intended USB speed (at load).
WinRAR 4.2
With 64-bit WinRAR, we compress the set of files used in the motherboard review USB speed tests. WinRAR x64 3.93 attempts to use multithreading when possible, and provides as a good test for when a system has variable threaded load. WinRAR 4.2 does this a lot better! If a system has multiple speeds to invoke at different loading, the switching between those speeds will determine how well the system will do.
Up first, WinRAR 3.93, with results expressed in terms of seconds to compress. Lower is better.
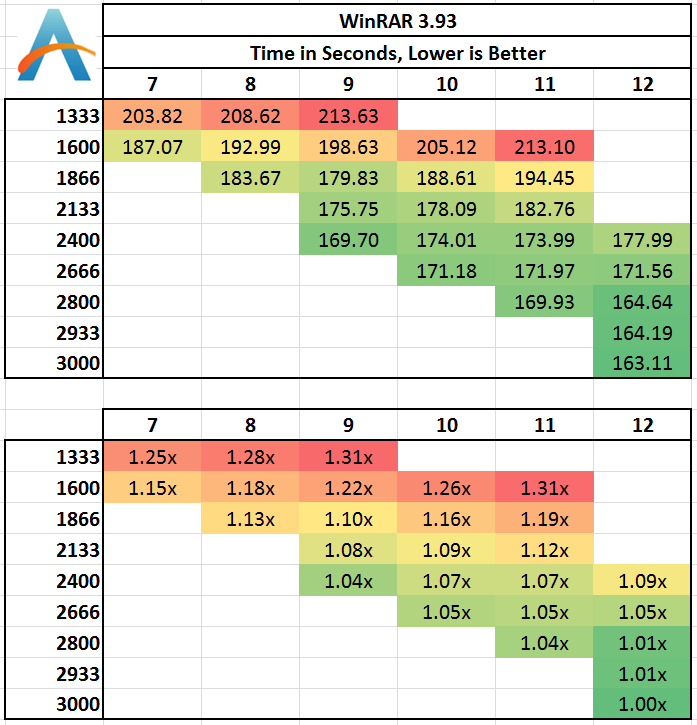
Using the older version of WinRAR shows a 31% advantage moving from 1333 C9 to 3000 C12, although 2400 C9/2666 C10/2800 C11 have a good showing.
WinRAR 4.2 results next:
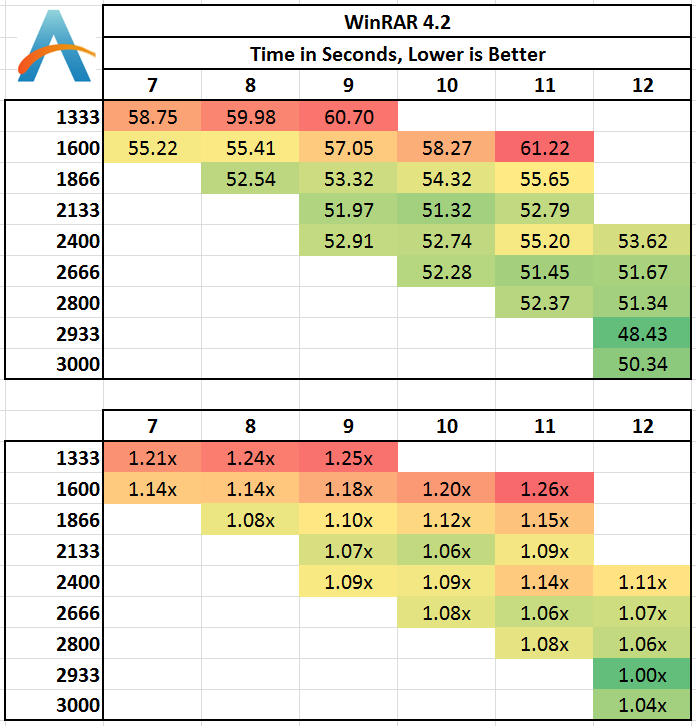
We see similar results with the later version of WinRAR – here having at least 1866 MHz memory gets above the grade in terms of time, lower CAS Latency helping (1866 C8 / 2133 C9 / 2400 C9 / 2666 C11)
FastStone Image Viewer 4.2
FastStone Image Viewer is a free piece of software I have been using for quite a few years now. It allows quick viewing of flat images, as well as resizing, changing color depth, adding simple text or simple filters. It also has a bulk image conversion tool, which we use here. The software currently operates only in single-thread mode, which should change in later versions of the software. For this test, we convert a series of 170 files, of various resolutions, dimensions and types (of a total size of 163MB), all to the .gif format of 640x480 dimensions. Results shown are in seconds, lower is better.
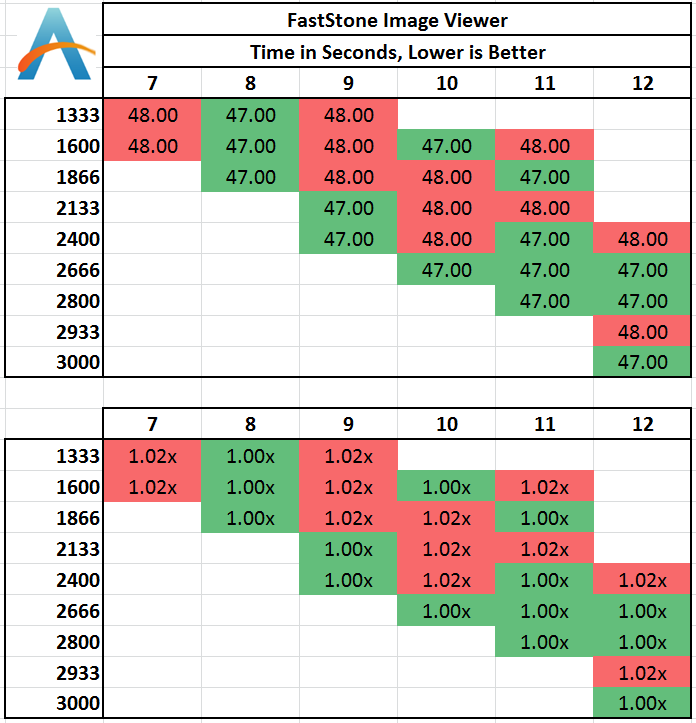
FastStone is purely a CPU limited benchmark, with little variation and no trend in the results. Discrepancies are part of the statistical variation expected with any result.
Xilisoft Video Converter 7
With XVC, users can convert any type of normal video to any compatible format for smartphones, tablets and other devices. By default, it uses all available threads on the system, and in the presence of appropriate graphics cards, can utilize CUDA for NVIDIA GPUs as well as AMD WinAPP for AMD GPUs. For this test, we use a set of 33 HD videos, each lasting 30 seconds, and convert them from 1080p to an iPod H.264 video format using just the CPU. The time taken to convert these videos gives us our result in seconds, where lower is better.
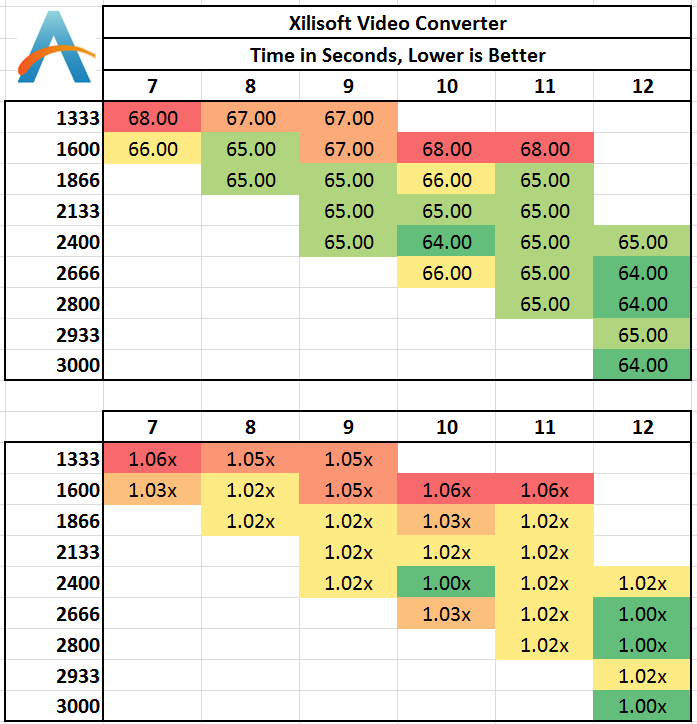
Similar to WinRAR, to avoid the ultra-slow speeds, anything above 1866 MHz seems to be the right way to go here.
Video Conversion - x264 HD Benchmark
The x264 HD Benchmark uses a common HD encoding tool to process an HD MPEG2 source at 1280x720 at 3963 Kbps. This test represents a standardized result which can be compared across other reviews, and is dependent on both CPU power and memory speed. The benchmark performs a 2-pass encode, and the results shown are the average frame rate of each pass performed four times. Higher is better this time around.

The higher frequency memory performs the best, but to get at least 5% speed up, DDR3-1866 comes along again.
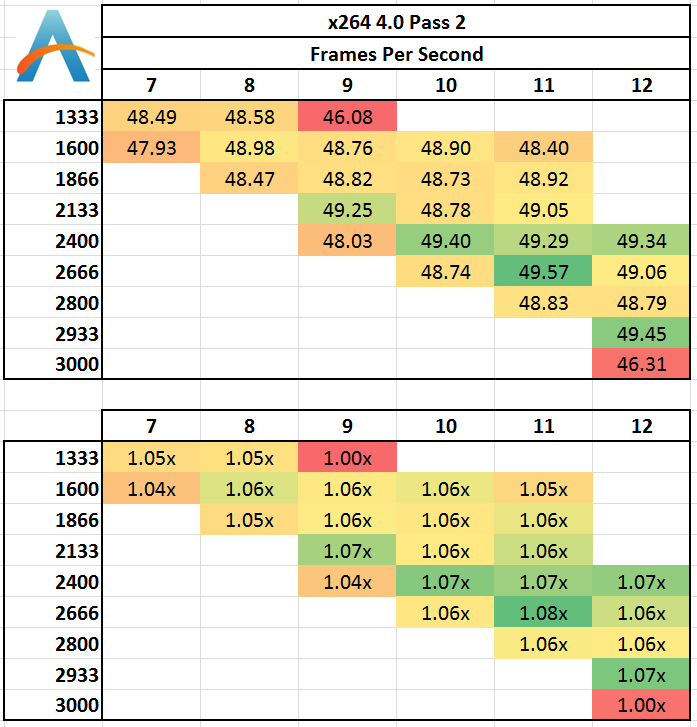
For whatever reason the 1333 C9 and 3000 C12 get a bad showing, but it seems as long as we avoid 1333 C9, any speed is reasonable for a 5-6% increase.
TrueCrypt v7.1a AES
One of Anand’s common CPU benchmarks is TrueCrypt, a tool designed to encrypt data on a hard-drive using a variety of algorithms. We take the program and run the benchmark mode using the fastest AES encryption protocol over a 1GB slice, calculating the speed in GB/s. Higher is better.
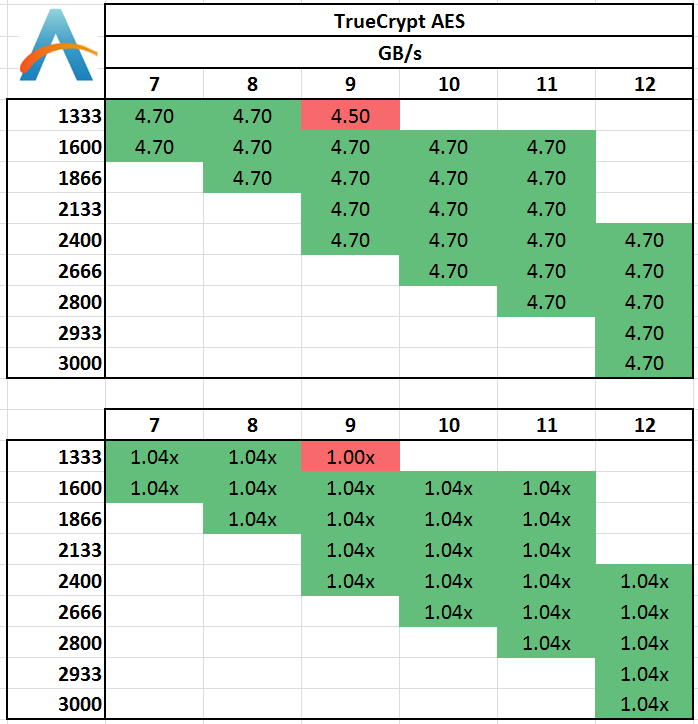
Similar to FastStone, there is nothing to differentiate the results. The only oddball here is technically our slowest memory speed: 1333 C9.


89 Comments
View All Comments
Rob94hawk - Friday, September 27, 2013 - link
Avoid DDR3 1600 and spend more for that 1 extra fps? No thanks. I'll stick with my DDR3 1600 @ 9-9-9-24 and I'll keep my Haswell overclocked at 4.7 Ghz which is giving me more fps.Wwhat - Friday, September 27, 2013 - link
I have RAM that has an XMP profile, but I did NOT enable it in the BIOS, reason being that it will run faster but it jumps to 2T, and ups to 1.65v from the default 1.5v, apart from the other latencies going up of course.Now 2T is known to not be a great plan if you can avoid it.
So instead I simply tweak the settings to my own needs, because unlike this article's suggestion you can, and overclockers will, do it manually instead of only having the options SPD or XMP..
The difference is that you need to do some testing to see what is stable, which can be quite different from the advised values in the settings chip.
So it's silly to ridicule people for not being some uninformed type with no idea except allowing the SPD/XMP to tell them what to do.
Hrel - Friday, September 27, 2013 - link
Not done yet, but so far it seems 1866 CL 9 is the sweet spot for bang/buck.I'd also like to add that I absolutely LOVE that you guys do this kind of in depth analyses. Remember when, one of you, did the PSU review? Actually going over how much the motherboard pulled at idle and load, same for memory on a per DIMM basis. CPU, everything, hdd, add in cards. I still have the specs saved for reference. That info is getting pretty old though, things have changed quite a bit since back then; when the northbridge was still on the motherboard :P
Hint Hint ;)
repoman27 - Friday, September 27, 2013 - link
Ian, any chance you could post the sub-timings you ended up using for each of the tested speeds?If you're looking at mostly sequential workloads, then CL is indicative of overall latency, but once the workloads become more random / less sequential, tRCD and tRP start to play a much larger role. If what you list as 2933 CL12 is using 12-14-14, then page-empty or page-miss accesses are going to look a lot more like CL13 or CL14 in terms of actual ns spent servicing the requests.
Also, was CMD consistent throughout the tests, or are some timings using 1T and others 2T?
There's a lot of good data in this article, but I constantly struggle with seeing the correlation between real world performance, memory bandwidth, and memory latency. I get the feeling that most scenarios are not bound by bandwidth alone, and that reducing the latency and improving the consistency of random accesses pays bigger dividends once you're above a certain bandwidth threshold. I also made the following chart, somewhat along the lines of those in the article, in order to better visualize what the various CAS latencies look like at different frequencies: http://i.imgur.com/lPveITx.png Of course real world tests don't follow the simple curves of my chart because the latency penalties of various types of accesses are not dictated solely by CL, and enthusiast memory kits are rarely set to timings such as n-n-n-3*n-1T where the latency would scale more consistently.
Wwhat - Sunday, September 29, 2013 - link
Good comment I must say, and interesting chart.Peroxyde - Friday, September 27, 2013 - link
"#2 Number of sticks of memory"Can you please clarify? What should be that number? The highest possible? For example, to get 16GB, what is the best sticks combination to recommend? Thanks for any help.
erple2 - Sunday, September 29, 2013 - link
I think that if you have a dual channel memory controller and have a single dimm, then you should fill up the controller with a second memory chip first.malphadour - Sunday, September 29, 2013 - link
Peroxyde, Haswell uses a dual channel controller, so in theory (and in some benchmarks I have seen) 2 sticks of 8gb ram would give the same performance as 4 sticks of 4gb ram. So go with the 2 sticks as this allows you to fit more ram in the future should you want to without having to throw away old sticks. You could also get 1 16gb stick of ram, and benchmarks I have seen suggest that there is only about a 5% decrease in performance, though for the tiny saving in cost you might as well go dual channel.lemonadesoda - Saturday, September 28, 2013 - link
I'm reading the benchmarks. And what I see is that in 99% of tests the gains are technical and only measurable to the third significant digit. That means they make no practical noticeable difference. The money is better spent on a difference part of the system.faster - Saturday, September 28, 2013 - link
This is a great article. This is valuable, useful, and practical information for the system builders on this site. Thank you!