NVIDIA GeForce GTX 780 Review: The New High End
by Ryan Smith on May 23, 2013 9:00 AM ESTCompute
Jumping into compute, we should see a mix of results here, with some tests favoring the GK110 based GTX 780’s more compute capable design, while other tests will punish it for not being a fast FP64 card like GTX Titan.
As always we'll start with our DirectCompute game example, Civilization V, which uses DirectCompute to decompress textures on the fly. Civ V includes a sub-benchmark that exclusively tests the speed of their texture decompression algorithm by repeatedly decompressing the textures required for one of the game’s leader scenes. While DirectCompute is used in many games, this is one of the only games with a benchmark that can isolate the use of DirectCompute and its resulting performance.
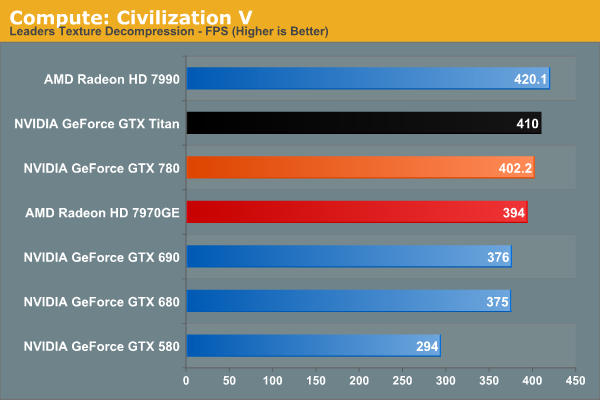
Civilization V’s DirectCompute performance is looking increasingly maxed out at the high end. At 402fps the GTX 780 may as well be tied with GTX Titan. On the other hand it’s a reminder that while we don’t always see NVIDIA do well in our more pure compute tests, it can deliver where it matters for games with DirectCompute.
Our next benchmark is LuxMark2.0, the official benchmark of SmallLuxGPU 2.0. SmallLuxGPU is an OpenCL accelerated ray tracer that is part of the larger LuxRender suite. Ray tracing has become a stronghold for GPUs in recent years as ray tracing maps well to GPU pipelines, allowing artists to render scenes much more quickly than with CPUs alone.
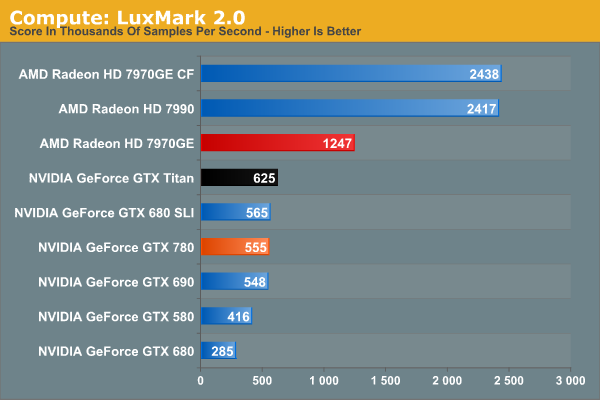
NVIDIA has never done well at LuxMark, and GTX 780 won’t change that. It’s greatly faster than GTX 680 and that’s about it. Kepler parts, including GK110, continue to have trouble with our OpenCL benchmarks, as evidenced by the fact that GTX 780 doesn’t beat GTX 580 by nearly as much as the generational improvements should lead to. GK110 is a strong compute GPU, but not in ways that LuxMark is going to benefit.
Our 3rd benchmark set comes from CLBenchmark 1.1. CLBenchmark contains a number of subtests; we’re focusing on the most practical of them, the computer vision test and the fluid simulation test. The former being a useful proxy for computer imaging tasks where systems are required to parse images and identify features (e.g. humans), while fluid simulations are common in professional graphics work and games alike.
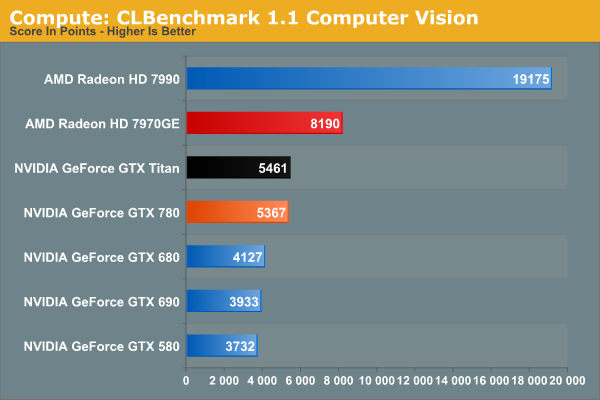
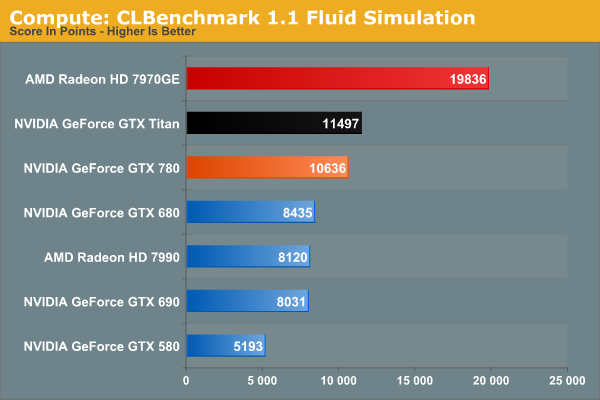
GTX 780 still struggles some at compute with CLBenchmark, but less so than with LuxMark. 7970GE is the clear winner here in both tests, while GTX 780 stays remarkably close to GTX Titan in performance. The fluid simulation in particular makes GTX 780 look good on a generational basis, more than doubling GTX 580’s performance.
Moving on, our 4th compute benchmark is FAHBench, the official Folding @ Home benchmark. Folding @ Home is the popular Stanford-backed research and distributed computing initiative that has work distributed to millions of volunteer computers over the internet, each of which is responsible for a tiny slice of a protein folding simulation. FAHBench can test both single precision and double precision floating point performance, with single precision being the most useful metric for most consumer cards due to their low double precision performance. Each precision has two modes, explicit and implicit, the difference being whether water atoms are included in the simulation, which adds quite a bit of work and overhead. This is another OpenCL test, as Folding @ Home has moved exclusively to OpenCL this year with FAHCore 17.
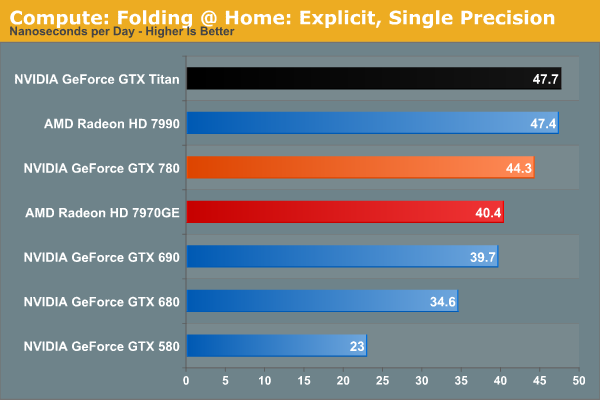
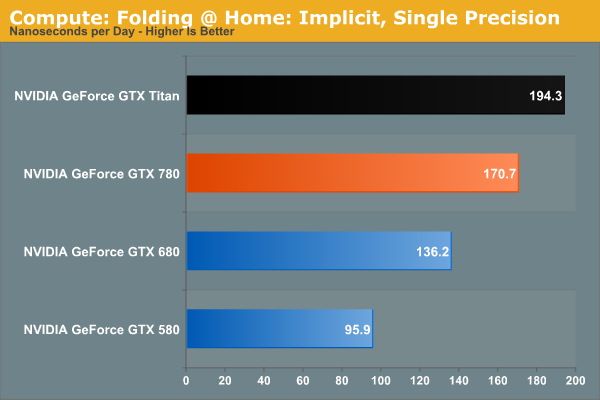
The Folding@Home group recently pushed out a major core update(FAHBench 1.2.0), which we’ve rerun on a number of cards and is reflected in our results. Unfortunately this version also broke single precision implicit on AMD GPUs and AMD’s latest drivers, so we only have NVIDIA GPUs for that section.
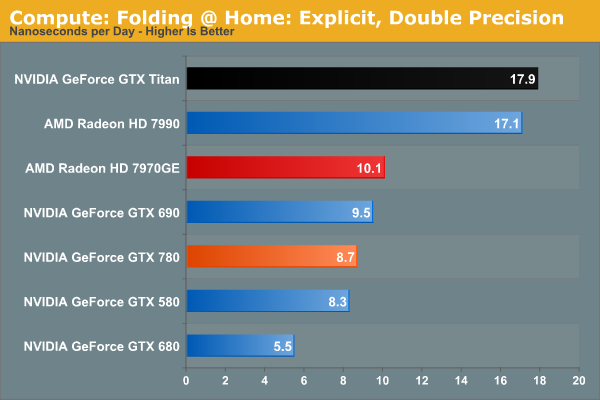
In any case, despite the fact that this is an OpenCL benchmark this is one of the cases where NVIDIA GPUs do well enough for themselves in single precision mode, with GTX 780 surpassing 7970GE, and falling behind only GTX Titan and the 7990. GTX 780 doesn’t necessarily benefit from GK110’s extra compute functionality, but it does see a performance improvement over GTX 680 that’s close to the theoretical difference in shader performance. Meanwhile in double precision mode, the lack of an uncapped double precision mode for GTX 780 means that it brings up the bottom of the charts compared to Titan and its 1/3 FP64 rate. Compute customers looking for a bargain NVIDIA card (relatively speaking) will need to stick with Titan.
Wrapping things up, our final compute benchmark is an in-house project developed by our very own Dr. Ian Cutress. SystemCompute is our first C++ AMP benchmark, utilizing Microsoft’s simple C++ extensions to allow the easy use of GPU computing in C++ programs. SystemCompute in turn is a collection of benchmarks for several different fundamental compute algorithms, as described in this previous article, with the final score represented in points. DirectCompute is the compute backend for C++ AMP on Windows, so this forms our other DirectCompute test.
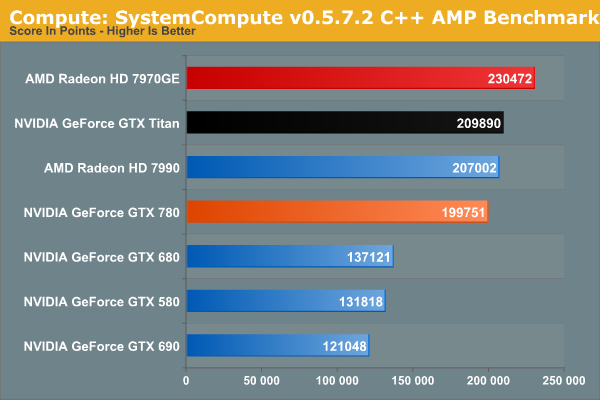
SystemCompute shows very clear gains over both the GTX 680 and GTX 580, while trailing the GTX Titan as expected. However like Titan, both trail the 7970GE.


155 Comments
View All Comments
mac2j - Thursday, May 23, 2013 - link
The problem with $650 vs $500 for this price point is this:I can get 2 x 7950s for <$600 - that's a setup that destroys a 780 for less money.
Even if you're single-GPU limited $250 is a lot of extra cash for a relative small amount of performance gain.
Ytterbium - Thursday, May 23, 2013 - link
I'm disappointed they decided to cut the compute to 1/24 vs 1/3 in Titan, AMD is much better value for compute tasks.BiffaZ - Friday, May 24, 2013 - link
Except much consumer (@home type) compute is SP not DP so it won't make much difference. SP performance is around equal or higher than AMD's in 780.Nighyal - Thursday, May 23, 2013 - link
I don't know if this is possible but it would be great to see a benchmark that showed power, noise and temperature at a standard work load. We can get an inferred idea of clock per watt performance but when you're measuring a whole system other factors come into play (you mentioned CPU loads scaling with increased GPU performance).My interest in this comes from living in a hot climate (Australia) where a computer can throw out a very noticeable amount of heat. The large majority of my usage is light gaming (LoL) but I occasionally play quite demanding single player titles which stretches the legs of my GPU. The amount of heat thrown out is directly proportional to power draw so to be able to clearly see how many less watts a system requires for a controlled work load would be a handy comparison for me.
TL:DR - Please also measure temperature, noise and power at a controlled workload to isolate clock per watt performance.
BiggieShady - Friday, May 24, 2013 - link
Kudos on the FCAT and the delta percentages metrics. So 32,2% for 7990 means that on average one frame is present 32,2% more time than the next. Still, it is only an average. Great extra info would be to show same metrics that averages only the deltas higher then the threshold delta, and display it on the graph with varying thresholds.flexy - Friday, May 24, 2013 - link
NV releases a card with a ridiculous price point of $1000. Then they castrate the exact same card and give it a new name, making it look like it's a "new card" and sell it cheaper than their way overpriced high end card. Which, of course, is a "big deal" (sarcasm) given the crazy price of Titan. So or so, I don't like what NV does, in the slightest.Many ages ago, people could buy *real* top of the line cards which always cost about $400-$500, today you pay $600 for "trash cards" which didn't make it into production for Titan due to sub-par chips. Nvidia:"Hey, let's just make-up a new card and sell those chips too, lols"
Please AMD, help us!!
bds71 - Friday, May 24, 2013 - link
for what it's worth, I would have like to have seen the 780 *truly* fill the gap between the 680 and titan by offering not only the gaming performance, but ALSO the compute performance - if they would have done a 1/6 or even 1/12!! to better fill the gap and round out the performance all around I would HAPPILY pay 650 for this card. as it is, I already have a 690, so I will simply get another for 4k gaming - but a comparison between 3x 780's and 2 690's (both very close to $2k) at 8Mpixels+ resolution would be extremely interesting. note: 3x 30" monitors could easily be configured for 4800x2560 resolution via NVidia surround or eyefinity - and I, for one, would love to see THAT review!!flexy - Friday, May 24, 2013 - link
Well compute performance is the other thing, along with their questionable GPU throttle aka "boost" (yeah right) technology. Paying premium for such a card and then weak compute performance in exchange compared to older gen cards or the AMD offerings... Seriously, there is a lot to not like about Kepler, at least from an enthusiast point of view. I hope that NV doesn't continue that route in the future with their cards becoming less attractive while prices go up.EJS1980 - Wednesday, May 29, 2013 - link
Cynical much?ChefJeff789 - Friday, May 24, 2013 - link
Glad to see the significant upgrade. I just hope that AMD forces the prices back down again soon. I hope the AMD release "at the end of the year" is closer to September than December. It'll be interesting to see how they stack up. BTW, I have shied away from AMD cards ever since I owned an X800 and had SERIOUS issues with the catalyst drivers (constant blue-screens, had to do a Windows clean-install to even get the card working for longer than a few minutes). I know this was a long time ago, and I've heard from numerous people that they're better now. Is this true?