The Seagate 600 & 600 Pro SSD Review
by Anand Lal Shimpi on May 7, 2013 8:00 AM ESTAnandTech Storage Bench 2013 Preview - 'The Destroyer'
When I built the AnandTech Heavy and Light Storage Bench suites in 2011 I did so because we didn't have any good tools at the time that would begin to stress a drive's garbage collection routines. Once all blocks have a sufficient number of used pages, all further writes will inevitably trigger some sort of garbage collection/block recycling algorithm. Our Heavy 2011 test in particular was designed to do just this. By hitting the test SSD with a large enough and write intensive enough workload, we could ensure that some amount of GC would happen.
There were a couple of issues with our 2011 tests that I've been wanting to rectify however. First off, all of our 2011 tests were built using Windows 7 x64 pre-SP1, which meant there were potentially some 4K alignment issues that wouldn't exist had we built the trace on a system with SP1. This didn't really impact most SSDs but it proved to be a problem with some hard drives. Secondly, and more recently, I've shifted focus from simply triggering GC routines to really looking at worst case scenario performance after prolonged random IO. For years I'd felt the negative impacts of inconsistent IO performance with all SSDs, but until the S3700 showed up I didn't think to actually measure and visualize IO consistency. The problem with our IO consistency tests are they are very focused on 4KB random writes at high queue depths and full LBA spans, not exactly a real world client usage model. The aspects of SSD architecture that those tests stress however are very important, and none of our existing tests were doing a good job of quantifying that.
I needed an updated heavy test, one that dealt with an even larger set of data and one that somehow incorporated IO consistency into its metrics. The new benchmark doesn't have a name, I've just been calling it The Destroyer (although AnandTech Storage Bench 2013 is likely a better fit for PR reasons).
Everything about this new test is bigger and better. The test platform moves to Windows 8 Pro x64. The workload is far more realistic. Just as before, this is an application trace based test - I record all IO requests made to a test system, then play them back on the drive I'm measuring and run statistical analysis on the drive's responses.
Imitating most modern benchmarks I crafted the Destroyer out of a series of scenarios. For this benchmark I focused heavily on Photo editing, Gaming, Virtualization, General Productivity, Video Playback and Application Development. Rough descriptions of the various scenarios are in the table below:
| AnandTech Storage Bench 2013 Preview - The Destroyer | ||||||||||||
| Workload | Description | Applications Used | ||||||||||
| Photo Sync/Editing | Import images, edit, export | Adobe Photoshop CS6, Adobe Lightroom 4, Dropbox | ||||||||||
| Gaming | Download/install games, play games | Steam, Deus Ex, Skyrim, Starcraft 2, BioShock Infinite | ||||||||||
| Virtualization | Run/manage VM, use general apps inside VM | VirtualBox | ||||||||||
| General Productivity | Browse the web, manage local email, copy files, encrypt/decrypt files, backup system, download content, virus/malware scan | Chrome, IE10, Outlook, Windows 8, AxCrypt, uTorrent, AdAware | ||||||||||
| Video Playback | Copy and watch movies | Windows 8 | ||||||||||
| Application Development | Compile projects, check out code, download code samples | Visual Studio 2012 | ||||||||||
While some tasks remained independent, many were stitched together (e.g. system backups would take place while other scenarios were taking place). The overall stats give some justification to what I've been calling this test internally:
| AnandTech Storage Bench 2013 Preview - The Destroyer, Specs | |||||||||||||
| The Destroyer (2013) | Heavy 2011 | ||||||||||||
| Reads | 38.83 million | 2.17 million | |||||||||||
| Writes | 10.98 million | 1.78 million | |||||||||||
| Total IO Operations | 49.8 million | 3.99 million | |||||||||||
| Total GB Read | 1583.02 GB | 48.63 GB | |||||||||||
| Total GB Written | 875.62 GB | 106.32 GB | |||||||||||
| Average Queue Depth | ~5.5 | ~4.6 | |||||||||||
| Focus | Worst case multitasking, IO consistency | Peak IO, basic GC routines | |||||||||||
SSDs have grown in their performance abilities over the years, so I wanted a new test that could really push high queue depths at times. The average queue depth is still realistic for a client workload, but the Destroyer has some very demanding peaks. When I first introduced the Heavy 2011 test, some drives would take multiple hours to complete it - today most high performance SSDs can finish the test in under 90 minutes. The Destroyer? So far the fastest I've seen it go is 10 hours. Most high performance I've tested seem to need around 12 - 13 hours per run, with mainstream drives taking closer to 24 hours. The read/write balance is also a lot more realistic than in the Heavy 2011 test. Back in 2011 I just needed something that had a ton of writes so I could start separating the good from the bad. Now that the drives have matured, I felt a test that was a bit more balanced would be a better idea.
Despite the balance recalibration, there's just a ton of data moving around in this test. Ultimately the sheer volume of data here and the fact that there's a good amount of random IO courtesy of all of the multitasking (e.g. background VM work, background photo exports/syncs, etc...) makes the Destroyer do a far better job of giving credit for performance consistency than the old Heavy 2011 test. Both tests are valid, they just stress/showcase different things. As the days of begging for better random IO performance and basic GC intelligence are over, I wanted a test that would give me a bit more of what I'm interested in these days. As I mentioned in the S3700 review - having good worst case IO performance and consistency matters just as much to client users as it does to enterprise users.
Given the sheer amount of time it takes to run through the Destroyer, and the fact that the test was only completed recently, I don't have many results to share. I'll be populating this database over the coming weeks/months. I'm still hunting for any issues/weirdness with the test so I'm not ready to remove the "Preview" label from it just yet. But the results thus far are very telling.
I'm reporting two primary metrics with the Destroyer: average data rate in MB/s and average service time in microseconds. The former gives you an idea of the throughput of the drive during the time that it was running the Destroyer workload. This can be a very good indication of overall performance. What average data rate doesn't do a good job of is taking into account response time of very bursty (read: high queue depth) IO. By reporting average service time we heavily weigh latency for queued IOs. You'll note that this is a metric I've been reporting in our enterprise benchmarks for a while now. With the client tests maturing, the time was right for a little convergence.
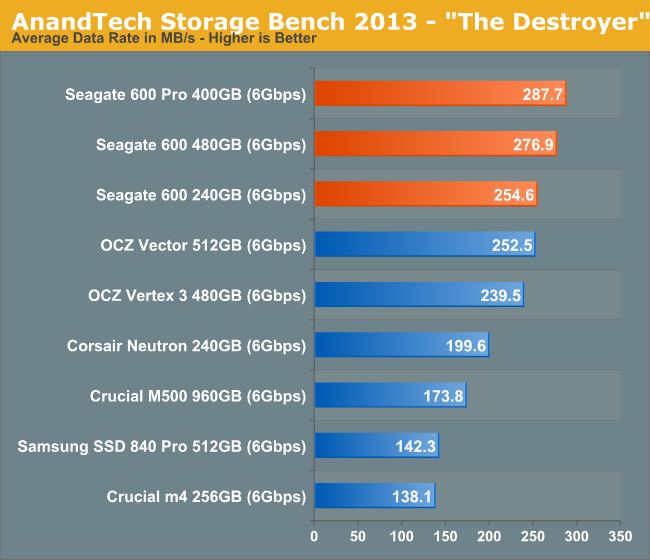
Now we see what Seagate's balance of consistency and peak performance gives us: leading performance in our latest benchmark. The Destroyer does a good job of penalizing drives with poor IO consistency as the entire drive is written to more than once, but the workload is more client-like than a pure 4KB random write. The result is a test that likes both peak performance and consistent behavior. Seagate's 600 delivers both. I purposefully didn't include a 120GB Seagate 600 here. This test was really optimized for 400GB+ capacities, at lower capacities (especially on drives that don't behave well in a full state) the performance dropoff can be significant. I'm not too eager to include 240/256GB drives here either but I kept some of the original numbers I launched the test with.
OCZ's Vector actually does incredibly well here, giving us more insight into the balance of peak performance/IO consistency needed to do well in our latest test.
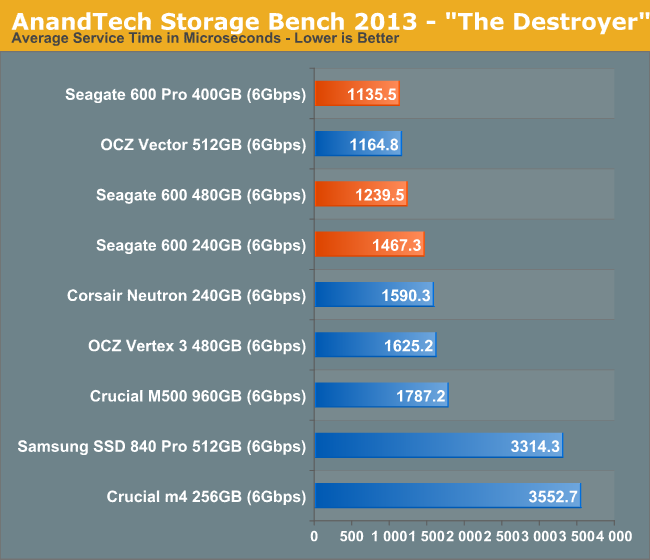
The 600's average service time throughout this test is very good. OCZ's Vector does even better here, outperforming the 480GB 600 and falling short of the 400GB 600 Pro. The difference between the 600 and 600 Pro here gives you a good idea of how much performance can scale if you leave some spare area on the drive.


59 Comments
View All Comments
Kristian Vättö - Wednesday, May 8, 2013 - link
I need to speak with Anand but $60 definitely doesn't sound too bad :-) Ultimately I think a meter that could log data e.g. every 100ms and the data could easily be import to Excel would be ideal as then we could easily make a graph of power usage over time, but knowing the overall usage would still be better than what we have now. Thanks for the suggestion!GamerGirl - Thursday, May 9, 2013 - link
wow this is really so fast...19nm of nand its ok for longlife?MelodyRamos47 - Sunday, May 12, 2013 - link
before I saw the draft 4 $9944, I did not believe ...that...my mother in law was like they say actually erning money in their spare time at their laptop.. there aunt started doing this 4 only fifteen months and by now cleard the mortgage on there villa and bourt a great new Chrysler. we looked here, Jump44.comCHECK IT OUTbards1888 - Monday, May 13, 2013 - link
A local supplier has this part in stock, ST480FN0021. It does not appear to be the 600 Pro as it has part number ST480FP0021.Does anyone know the difference ?
vdidenko - Wednesday, May 29, 2013 - link
I am known to fill up all storage available, so it will be hard to stick to the 10-20% free space rule for me. However, would partitioning the disk so that 20% of it is not allocated to a partition do the trick technologically? It surely will force me...aSSDtech - Tuesday, July 2, 2013 - link
I don't think 4 Tantulium Capacitors can make SSDs suvive upon sudden host power loss. 4*470uF can not meet the power of the SSD needs because the power comsumption is generally 4W and the data needs to be flushed down are more than 4 seconds because the DRAMs and the write speed.RaresIonut - Wednesday, December 11, 2013 - link
Hi,Very nice review!
I ordered a Seagate s600 120GB and I should get it by tomorow.
There's one thing that bothers me regarding ssd's (particulary mine): does the Seagate s600 120GB have TRIM support? Does it need TRIM support?
Sorry if this was mentioned somewhere in the article, I'm reading iton a bus :(
Thank you! :)
drben - Wednesday, December 18, 2013 - link
Sisco Chemicals Inc.:leads in SSD automatic chemical solution for cleaning black money and any color of defaced currency is available in our laboratory worldwide. Our S.S.D Automatic solution is also used in the cleaning of stained bank notes with anti breeze quality, bills like USD, euro, pounds and other local currency.We are direct manufacturer and main supplier of all kinds of chemicals which include SSD Solution ,
Super Automatic Solution.we have different types of chemicals that can perfectly clean out your Deface note, Black note , Red notes ,Green notes ,Stained notes ,Stamped notes and also coded notes We also melt frozen chemicals in our laboratory and our services are professional We thus Provide legal document for all our product.
Email ssdsiscochemicals@doctor.com
Mobile: +918447250476
Address:No.9 Boat Club Road,Raja Annamalai Puram Chennai,TN
Name: DR Ben Bruce
Sisco Chemnicals Inc.
Delicate - Monday, January 20, 2014 - link
As per this article - http://www.techarena.in/review/258133-seagate-600-... in the Indian market this hard drive is way to costly which comes at Rs. 9000. Being a hard drive for extreme pc and gaming does not mean that it should be so much costly.