The Crucial/Micron M500 Review (960GB, 480GB, 240GB, 120GB)
by Anand Lal Shimpi on April 9, 2013 9:59 AM ESTPerformance Consistency
In our Intel SSD DC S3700 review I introduced a new method of characterizing performance: looking at the latency of individual operations over time. The S3700 promised a level of performance consistency that was unmatched in the industry, and as a result needed some additional testing to show that. The reason we don't have consistent IO latency with SSDs is because inevitably all controllers have to do some amount of defragmentation or garbage collection in order to continue operating at high speeds. When and how an SSD decides to run its defrag and cleanup routines directly impacts the user experience. Frequent (borderline aggressive) cleanup generally results in more stable performance, while delaying that can result in higher peak performance at the expense of much lower worst case performance. The graphs below tell us a lot about the architecture of these SSDs and how they handle internal defragmentation.
To generate the data below I took a freshly secure erased SSD and filled it with sequential data. This ensures that all user accessible LBAs have data associated with them. Next I kicked off a 4KB random write workload across all LBAs at a queue depth of 32 using incompressible data. I ran the test for just over half an hour, no where near what we run our steady state tests for but enough to give me a good look at drive behavior once all spare area filled up.
I recorded instantaneous IOPS every second for the duration of the test. I then plotted IOPS vs. time and generated the scatter plots below. Each set of graphs features the same scale. The first two sets use a log scale for easy comparison, while the last set of graphs uses a linear scale that tops out at 40K IOPS for better visualization of differences between drives.
The high level testing methodology remains unchanged from our S3700 review. Unlike in previous reviews however, I did vary the percentage of the drive that I filled/tested depending on the amount of spare area I was trying to simulate. The buttons are labeled with the advertised user capacity had the SSD vendor decided to use that specific amount of spare area. If you want to replicate this on your own all you need to do is create a partition smaller than the total capacity of the drive and leave the remaining space unused to simulate a larger amount of spare area. The partitioning step isn't absolutely necessary in every case but it's an easy way to make sure you never exceed your allocated spare area. It's a good idea to do this from the start (e.g. secure erase, partition, then install Windows), but if you are working backwards you can always create the spare area partition, format it to TRIM it, then delete the partition. Finally, this method of creating spare area works on the drives we've tested here but not all controllers may behave the same way.
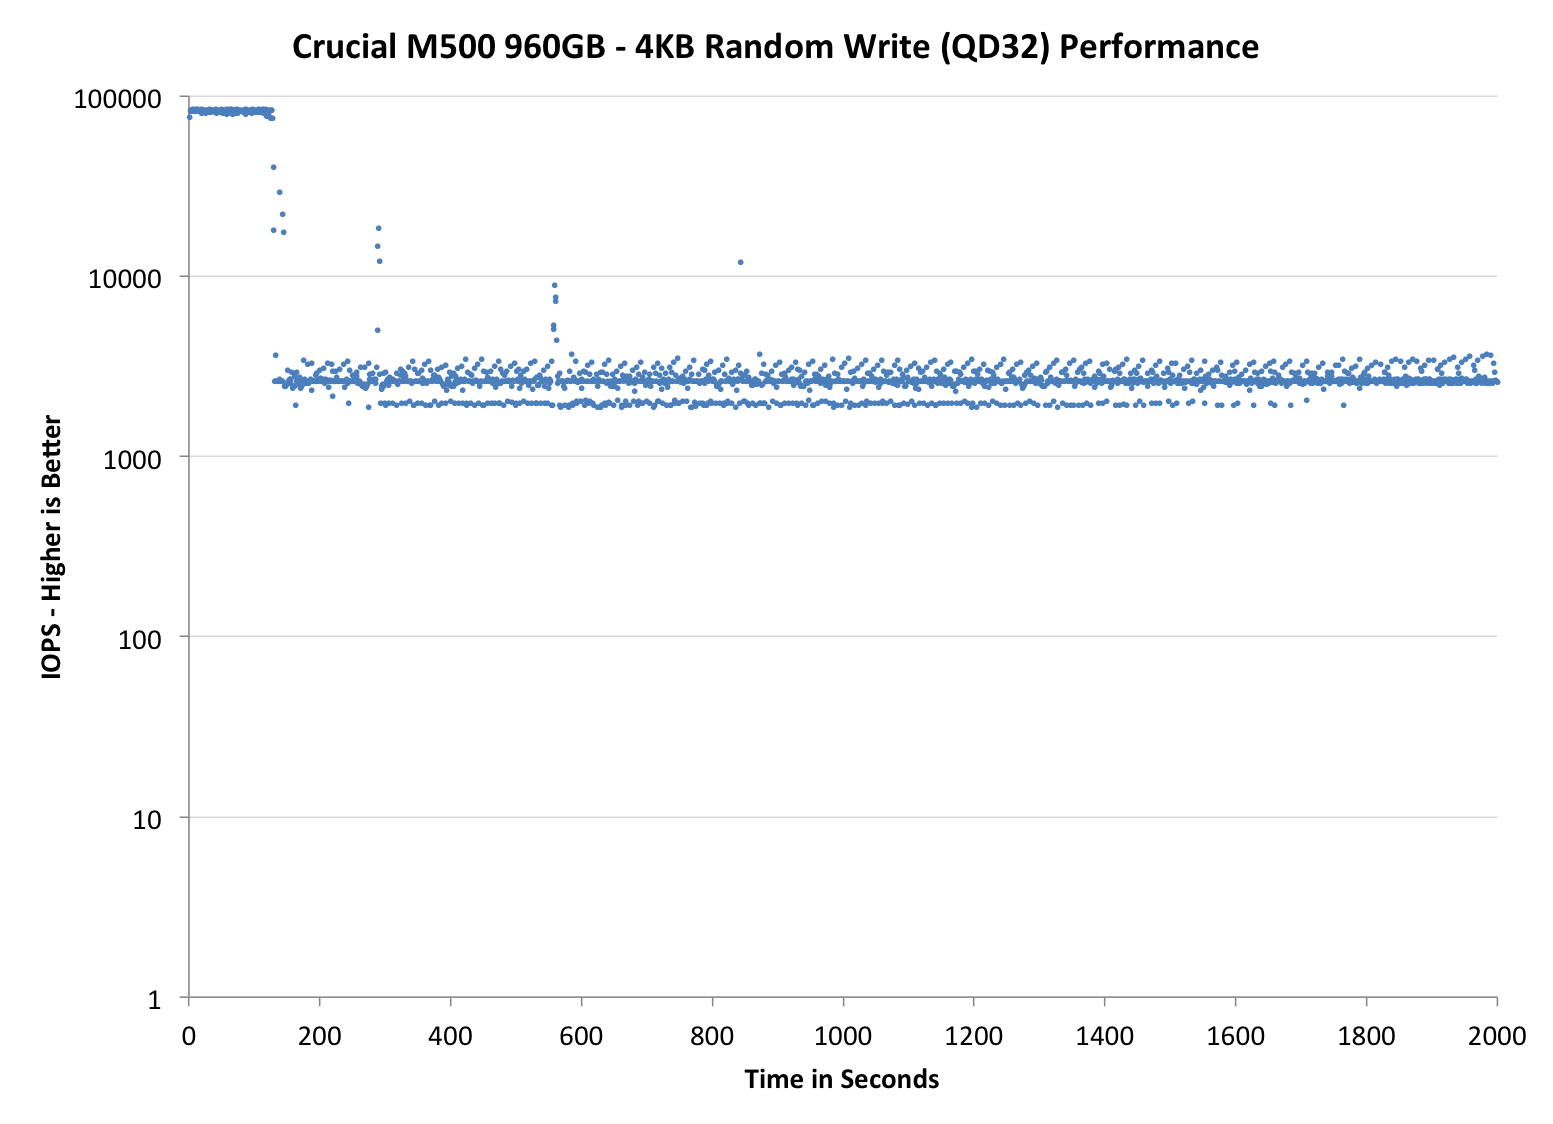
The first set of graphs shows the performance data over the entire 2000 second test period. In these charts you'll notice an early period of very high performance followed by a sharp dropoff. What you're seeing in that case is the drive allocating new blocks from its spare area, then eventually using up all free blocks and having to perform a read-modify-write for all subsequent writes (write amplification goes up, performance goes down).
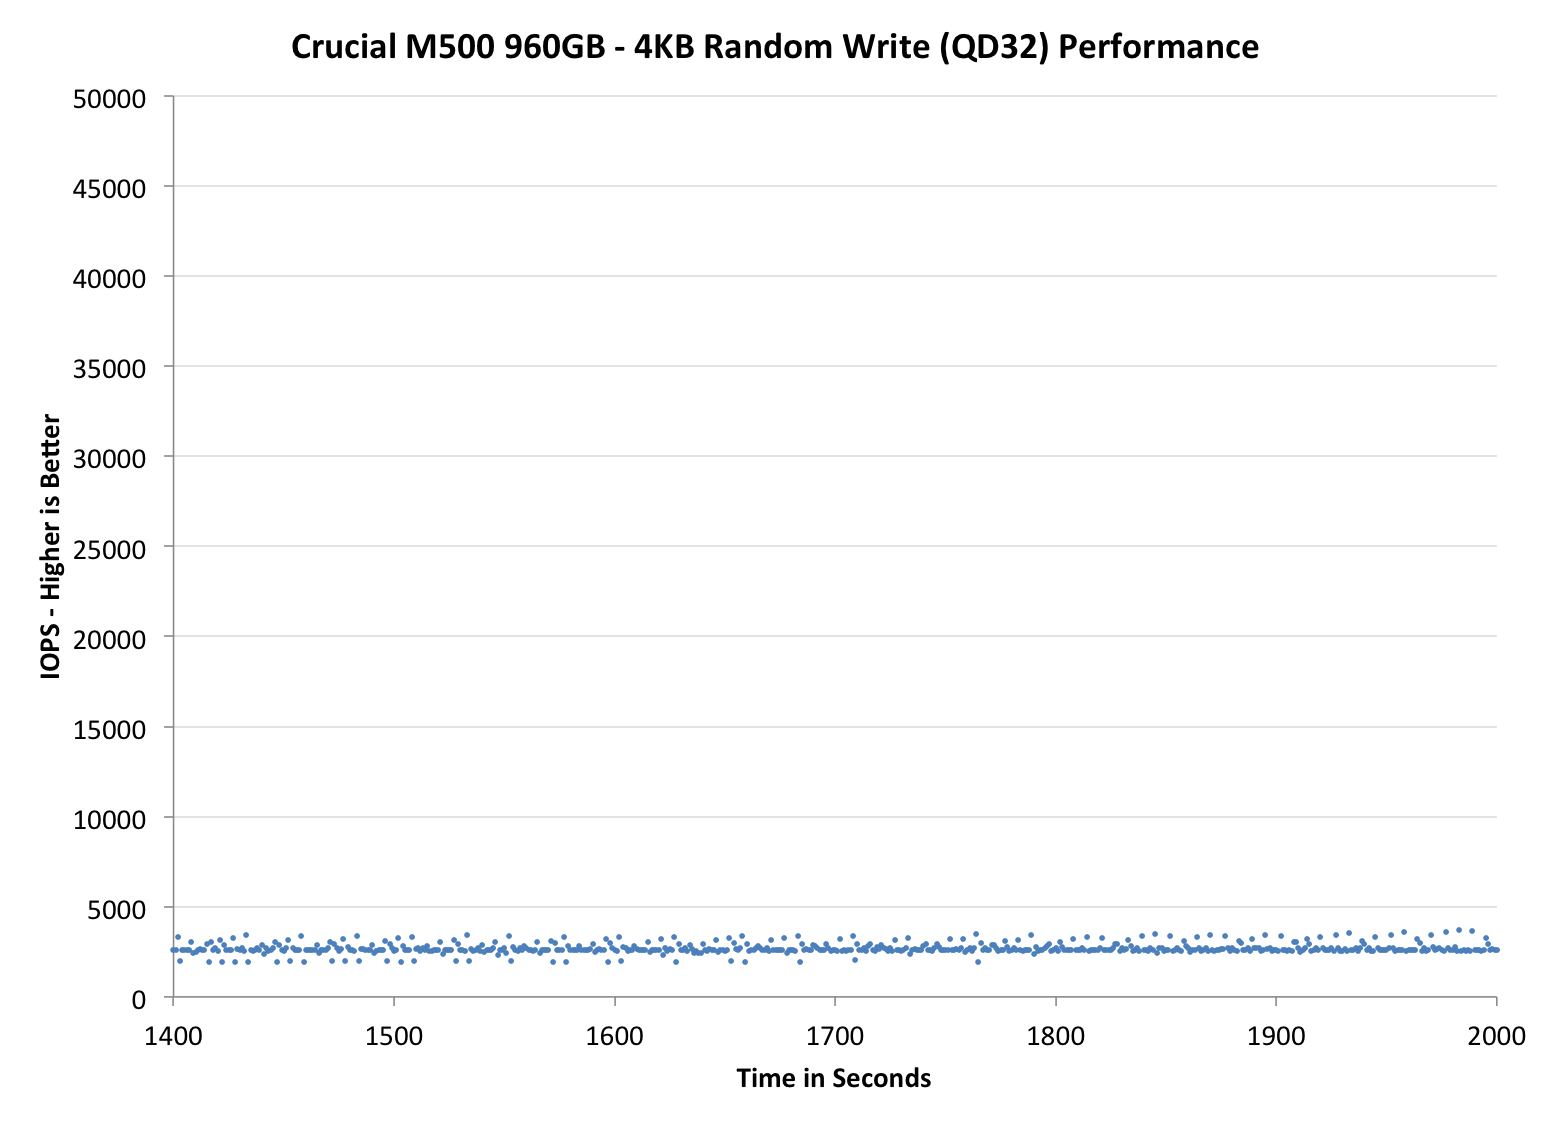
The second set of graphs zooms in to the beginning of steady state operation for the drive (t=1400s). The third set also looks at the beginning of steady state operation but on a linear performance scale. Click the buttons below each graph to switch source data.
 |
|||||||||
| Corsair Neutron 240GB | Crucial m4 256GB | Crucial M500 960GB | Plextor M5 Pro Xtreme 256GB | Samsung SSD 840 Pro 256GB | |||||
| Default | |||||||||
| 25% Spare Area | |||||||||
Like most consumer drives, the M500 exhibits the same pattern of awesome performance for a short while before substantial degradation. The improvement over the m4 is just insane though. Whereas the M500 sees its floor at roughly 2600 IOPS, the m4 will drop down to as low as 28 IOPS. That's slower than mechanical hard drive performance and around the speed of random IO in an mainstream ARM based tablet. To say that Crucial has significantly improved IO consistency from the m4 to the M500 would be an understatement.
Plextor's M5 Pro is an interesting comparison because it uses the same Marvell 9187 controller. While both drives attempt to be as consistent as possible, you can see differences in firmware/gc routines clearly in these charts. Plextor's performance is more consistent and higher than the M500 as well.
The 840 Pro comparison is interesting because Samsung manages better average performance, but has considerably worse consistency compared to the M500. The 840 Pro does an amazing job with 25% additional spare area however, something that can't be said for the M500. Although performance definitely improves with 25% spare area, the gains aren't as dramatic as what happens with Samsung. Although I didn't have time to run through additional spare are points, I do wonder if we might see better improvements with even more spare area when you take into account that ~7% of the 25% spare area is reserved for RAIN.
 |
|||||||||
| Corsair Neutron 240GB | Crucial m4 256GB | Crucial M500 960GB | Plextor M5 Pro Xtreme 256GB | Samsung SSD 840 Pro 256GB | |||||
| Default | |||||||||
| 25% Spare Area | |||||||||
I am relatively pleased by the M500's IO consistency without any additional over provisioning. I suspect that anyone investing in a 960GB SSD would want to use as much of it as possible. At least in the out of box scenario, the M500 does better than the 840 Pro from a consistency standpoint. None of these drives however holds a candle to Corsair's Neutron however. The Neutron's LAMD controller shows its enterprise roots and delivers remarkably high and consistent performance out of the box.
 |
|||||||||
| Corsair Neutron 240GB | Crucial m4 256GB | Crucial M500 960GB | Plextor M5 Pro Xtreme 256GB | Samsung SSD 840 Pro 256GB | |||||
| Default | |||||||||
| 25% Spare Area | |||||||||


111 Comments
View All Comments
Crazy1 - Tuesday, April 9, 2013 - link
Using the 2012 charts from Tom's Hardware I was able to compile some numbers between the 840 pro and popular mobile HDDs. While not a comprehensive comparison, these numbers are coming from a single source, so they should be reliable enough to provide a general understanding that there is a power savings when using an SSD instead of an HDD. These are the average power consumption numbers during the following workloads.------------------------------------idle----------video playback---------Database-
840Pro 128GB 0.03W 0.4W 1.2W
840Pro 256GB 0.03W 0.5W 1.4W
840Pro 512GB 0.04W 0.6W 1.5W
WD blue 500GB 0.36W 0.94W 2.2W
WD blue 1TB 0.6W 1.1W 1.9W
WD black 750GB 0.9W 1.4W 2.4W
Seagate XT 750GB* 0.8W 2.1W 2.6W
* The XT 750GB is running sata III. The XT 500GB running sata II gives power numbers closer to the two WD Blue drives.
It's fairly clear from these numbers that the 840pro uses less power than mobile HDD's. This isn't true for all SSD's though. Some of the Sandforce-based SSDs result in similar average wattage numbers as WD Blue drives. Those SSDs are still more power efficient because they have a better performance-per-watt ratio.
Crazy1 - Tuesday, April 9, 2013 - link
My table was ruined. Hopefully this is easier to read.------------------------------------idle----------video playback---------Database-
840Pro 128GB _______0.03W ________0.4W__________ 1.2W
840Pro 256GB _______0.03W ________0.5W __________1.4W
840Pro 512GB _______0.04W ________0.6W __________1.5W
WD blue 500GB ______0.36W ________0.94W _________2.2W
WD blue 1TB ________ 0.6W _________1.1W __________1.9W
WD black 750GB _____0.9W _________1.4W __________2.4W
Seagate XT 750GB*___0.8W _________2.1W __________2.6W
vol7ron - Monday, December 9, 2013 - link
Take it to the forumsleexgx - Tuesday, July 1, 2014 - link
personally do not trust TW site but SSDs do use less power then an HDD over the same time (say 10-30 seconds) Peak power on some SSDs mite be higher then an laptop HDD but that be for an extreme short times so a SSD will be idle for most of the time where as HDD is very likely going to be still be active reading due to its Slow random access speeds (Writes normally but your typical laptop is mostly reads, HDDs reads and writes are about the same power wise)Wolfpup - Monday, April 15, 2013 - link
Yeah, SSDs don't automatically use less power than mechanical drives...and for that matter aren't automatically more reliable either.Arkive - Tuesday, April 9, 2013 - link
"Bang for the buck" depends entirely on how much storage you need and it's use-case.UltraTech79 - Saturday, April 13, 2013 - link
Did you just want to be the guy that made a shocking statement or something? Even if its totally fucking false? SSD wont be better bang for the buck for at least another two generations, probably three.And everyone discussing power req. is amusing. We are talking about fractions of cents, people, and if you think that adds up somehow in a server environment, you forgot to 'add up' the fact that these will not last even half as long as a enterprise quality HDD/SDD, so your going to have to replace them at least once. Bang for the buck? Bullshit. What these things are, are awesome fast preforming little pieces of amazing - but you will pay for it, get real.
leexgx - Tuesday, July 1, 2014 - link
he was talking about laptop hdds,but still mostly incorrect as Most SSDs idle at under 0.1w where an SSD will be at for most of its life (assuming consumer laptop, not server or workstation loads)mutantmagnet - Wednesday, April 17, 2013 - link
SSDs are dramatically more vulnerable to brown outs and power surges than mechanical drives. This SSD's price point made me consider briefly I could forgo hard drives completely but SSDs aren't quite there yet.leexgx - Tuesday, July 1, 2014 - link
interesting (bit of old post to reply to) an SSD dieing to a power surge, i would resolve your issue first