FCAT: The Evolution of Frame Interval Benchmarking, Part 1
by Ryan Smith on March 27, 2013 9:00 AM ESTEnter FCAT
In our comprehensive look at stuttering and FRAPS, we laid out what our ideal method would be for measuring frame intervals. Ideally we would like to be able to tag a frame from the start of the rendering pipeline to the end, comparing frames as they come in and out of the rendering pipeline by time stamping frames and then comparing the intervals in those time stamps to the intervals between the frames at the end of the rendering pipeline when they are displayed. Ideally, these two intervals would match up (or be close enough), with the simulation time between frames coming at an even pace, and the frame interval itself coming at an even pace.
Of course in the real world this isn’t quite impossible, but it’s highly impractical due to the fact that it requires the participation and assistance of the application itself to write the time stamps (by the time draw calls are being made, it’s too late). In lieu of that, simply being able to look at the end of the rendering pipeline would be a major benefit. After all, the end of the rendering pipeline is where frame swaps actually happen, and it is the position in the rendering pipeline that best describes what the user is seeing. If FRAPS isn’t enough because it can only see the start of the rendering pipeline, then the logical next step is to look at the end of the rendering pipeline instead.
This brings us to the subject of today’s article, FCAT, the Frame Capture Analysis Tool.
As we mentioned in our look at stuttering yesterday, as it turns out both NVIDIA and AMD agree with the fundamental problem of trying to judge frame intervals from the start of the rendering pipeline. For the past couple of years NVIDIA has been working on an alternative tool to measure frame latency at the end of the rendering pipeline, and at long last they are releasing this tool to reviewers and the public. This tool is FCAT.
So what is FCAT? FCAT is essentially a collection of tools, but at its most fundamental level FCAT is a simple, yet ingenious method to measure frame latency at the end of the rendering pipeline. Rather than attempting to tap into the video drivers themselves – a process inherently fraught with problems if you’re intending to do it in a vendor-neutral manner that works across all video cards – through FCAT NVIDIA can do true frame analysis, capturing individual frames and looking at them to determine when a buffer swap occurred, and in turn using that to measure the frame interval.
How FCAT Works
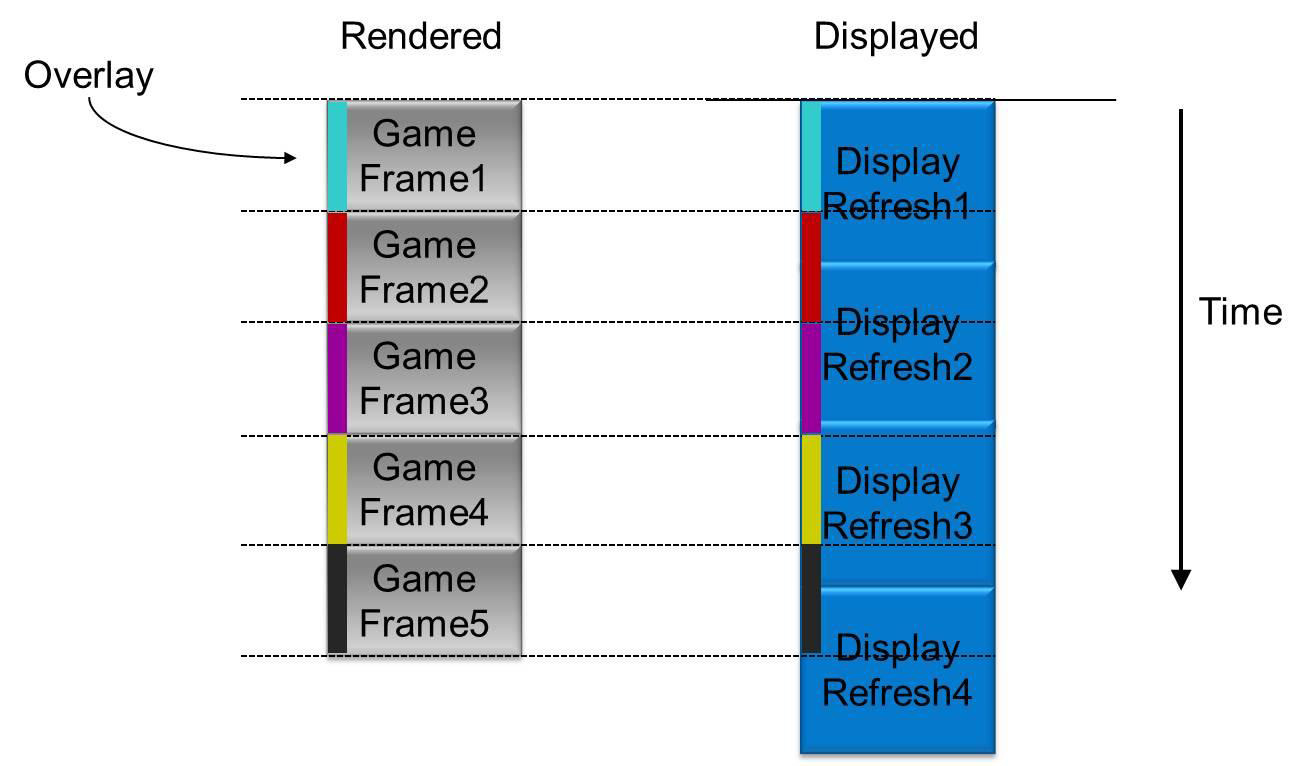
So how does FCAT work? FCAT is essentially a 2 part solution. We’ll dive into greater detail on this in part 2 of our FCAT article, but in summary, due to the inner-workings of video cards, monitors, and PC capture cards, both monitors and PC capture cards work at fixed intervals. Regardless of the frame rate an application is running at, most PC LCD monitors operate at a 60Hz refresh interval. In the case of v-sync this means buffer swaps are synchronized with the refresh interval (which among other things caps the framerate at 60fps), but when v-sync is disabled, buffer swaps can occur in the middle of a refresh. As a result any given refresh interval can be composed of multiple frames. This makes it possible to display well over 60fps on what’s otherwise a 60Hz monitor, with the end result being that multiple frames can be in one refresh interval.
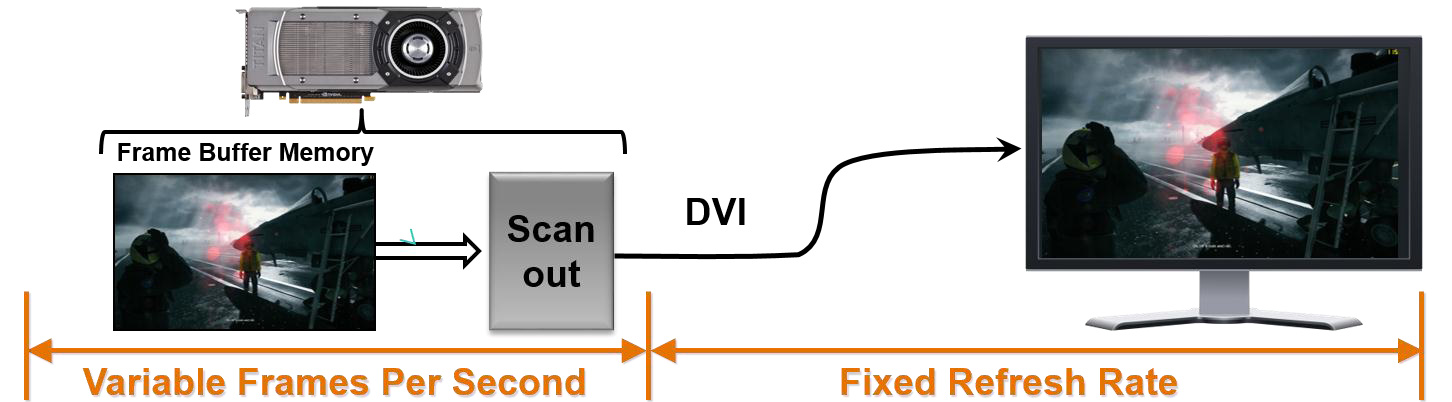
PC capture cards work on the same principle, and just as how a monitor would refresh at 60Hz a PC capture card will capture at 60Hz. The end result being that while a PC capture card can’t see more than 60 whole frames, it can see parts of those frames, and being able to see parts of frames is good enough. In fact it sees the same parts of those frames that a user would see, since the 60Hz refresh rate on a monitor causes the same effect.
Ultimately by capturing frames and analyzing them, it is possible to tell how many frames were delivered in any given refresh interval, and furthermore by counting the time between those partial frames and comparing it to the refresh interval, it is possible to compute just how long the frame interval was and how long any individual frame was visible.
Of course doing this on a raw game feed would be difficult in the best of situations. As a simple thought experiment, consider a game where the player isn’t moving. If nothing changes in the image, how is one to be able to tell if a new frame has been delivered or not?
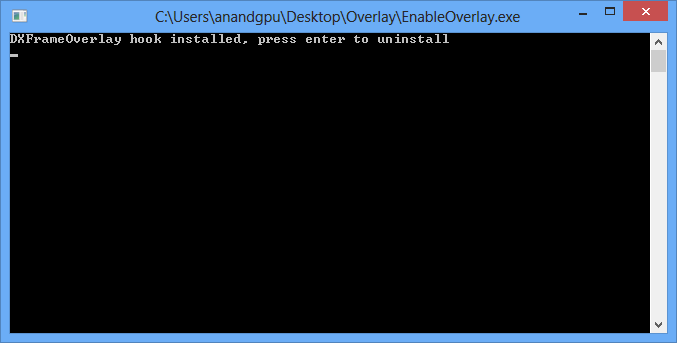
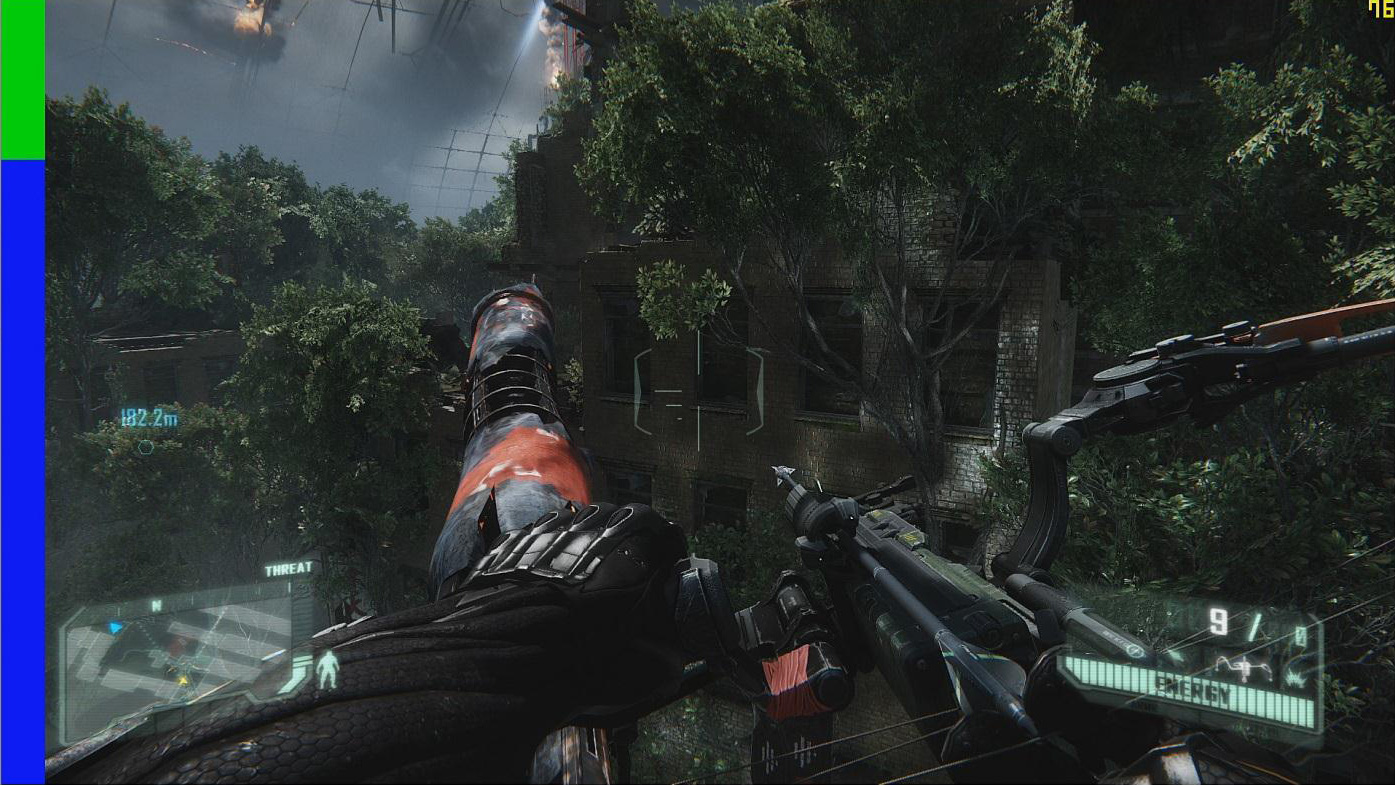
The solution to this is in the first-half of FCAT, the overlay tool. The overlay tool at its most basic level is a utility that color-codes each frame entering the rendering pipeline. By tagging frames with color bars, it is possible to tell apart individual frames by looking at the color bars. Regardless of the action on the screen (or lack thereof), the color bars will change with each successive frame, making each frame clear and obvious.
On a technical level, the FCAT overlay tool ends up working almost identically to video game overlays as we see with FRAPS, MSI Afterburner, and other tools that insert basic overlays into games. In all of these cases, these tools are attaching themselves to the start of the rendering pipeline, intercepting the Present call, adding their own draw commands for their overlay, and then finally passing on the Present call. The end result is that much like how FRAPS is able to quickly and simply monitor framerates and draw overlays, the FCAT overlay tool is able to quickly insert the necessary color bars, and to do so without ever touching the GPU or video drivers.
With the frames suitably tagged, the other half of the FCAT solution comes into play, the extractor tool. By using a PC capture card, the entire run of a benchmark can be captured and recorded to video for analysis. The extractor tool in turn is what’s responsible for looking at the color bars the overlay tool inserts, parsing the data from a video file to find the individual frames and calculate the frame intervals. Though not the easiest thing to code, conceptually this process is easy; the tool is merely loading a frame, analyzing each line of the color bar, finding the points where the color bar changes, and then recording those instances.

This ultimately results in a Tab Seperated Values file that contains a list of frames, when they occurred, the color bar they were attached to, and more. From here it is possible to then further process the data to calculate the frame intervals.
The end result of this process is that through the use of marking frames, capturing the output of a video card, and then analyzing that output, it is possible to objectively and quantitatively measure the output of a video card as an end-user would see it. This process doesn’t answer the subjective questions for us – mainly, how much stutter is enough to be noticed – but it gives us numbers that we can use to determine those answers ourselves.
Finally, for the purposes of this article we’ll be glossing over the analysis portion of FCAT, but we’ll quickly mention it. Along with the overlay and extractor tools, FCAT also includes a tool to analyze the output of the extractor tool, from which it can generate graphs, identify so-called “runt” frames, and more. The analysis tool is not strictly necessary to use FCAT – one can always do their own analysis – but the analysis tool does simplify the use of the suite by quickly and conveniently handling that last step of the process. We’ll get into the analysis tool in much greater detail in part 2 of our article, where we can apply it to our full suite of test results to better understand what it looks for and what it’s representing.


88 Comments
View All Comments
Dribble - Wednesday, March 27, 2013 - link
No tech report have something very similar to what is described above with the colour bars - it's what detected the runt frames that afflict xfire. The nvidia tool looks like a more professional complete solution, but tech report did it first.Klimax - Thursday, March 28, 2013 - link
You will still need FRAPS like tools, because FCAT won't see some problems and changes in pipeline.Hrel - Wednesday, March 27, 2013 - link
making it a simple an effective tool - and*it can only do at the start of the rendering pipeline - it can only do so* at the...
Taracta - Wednesday, March 27, 2013 - link
A color bar can hold a whole lot of information. From my reasoning, it might be possible to timestamp each line in a frame, but let's not get that detailed. How about just timestamping each frame and coding the information in the overlay. Each 24-bit pixel of the overlay is 3 bytes of information. An overlay at about 10 pixels wide would give 30 bytes of information on each line. This should be enough to timestamp the frame from were FRAPS would get its information to be compared with the time of what come out at the end of the pipeline. Why wouldn't this be possible?Rythan - Wednesday, March 27, 2013 - link
Agreed. Ideally, you'd write a frame number and timestamp on each line of the overlay (as FRAPS/FCAT does), and separately transmit the frame number and timestamp to the video capture system (a simple 32-bit GPIO interface would do). This would tell you everything about latency, stutter, and dropped frames from the PRESENT call to the montior.Ryan Smith - Wednesday, March 27, 2013 - link
Unfortunately that won't work. The timestamp needs to be generated at the moment the simulation state finalized, before the draw calls are sent off. Present is too late, particularly because a pipeline stall means that Present may come well after the simulation state has been finalized.Taracta - Wednesday, March 27, 2013 - link
The whole issue is not the simulation state but what happens between Present and your Display. The accuracy of what is being stimulated is not what the beanchmark is about (it would be nice to have a benchmark for that) but to measure the frame latency introduced by the graphics pipeline.shtldr - Thursday, March 28, 2013 - link
At least the game/benchmark could encode the simulation time when it calls "present" and the capture analysis tool could then discover fluctuations in the time difference between simulation time and shown-on-the-screen time. Ideally, such a difference should be constant all the time, leading to a perfectly smooth rendering of the simulation. This is what someone has already pointed out earlier in the comments.arbiter9605 - Wednesday, April 17, 2013 - link
i might be off, Like how frap's puts in its overlay of fps, dxframe overlay, puts the color on each frame in same way so colors are on each frame that through drivers, gpu, directx etc.toyotabedzrock - Wednesday, March 27, 2013 - link
Why can't they just send back a signal when the buffer swap happens? It seems that drawing more stuff on the screen adds a delay to rendering.