Micron P400m Review (200GB)
by Anand Lal Shimpi on February 13, 2013 12:00 AM ESTPerformance Consistency
Over the years we've seen SSD makers shift focus from sequential performance, to random performance and more recently towards IO consistency. Prolonged random IO can create a ton of fragmentation both in the NAND and, if applicable, in a SSD's indirection table. A drive without a powerful enough controller, a smart enough algorithm and/or enough spare area will see tremendous variance between even adjacent IOs. Inconsistent IO latency can result in inconsistent application performance, which for a web-facing server can manifest itself as inconsistent page load times for your users. Even more visible are in situations where your server is delivering visual content to your users. Inconsistent drive latency here can appear, in the worst case, as stutters in playback or even loss of quality (if your application dynamically adjusts streaming quality based on server performance). If you're running a large array of SSDs, the total performance of the array is bound by the slowest drive - in the case of an array of drives with highly variable performance, that minimum level of performance can actually end up being far slower than you're expecting.
Performance consistency matters, but it requires a somewhat different methodology to analyze. We focus on random write latency as that's really the worst case scenario for IO variance. Reads are fairly consistent, as are sequential writes. It's random writes that cause problems.
To generate the data below I took a freshly secure erased SSD and filled it with sequential data. This ensures that all user accessible LBAs have data associated with them. Next I kicked off a 4KB random write workload at a queue depth of 32 using incompressible data. I ran the test for just over half an hour, no where near what we run our steady state tests for but enough to give me a good look at drive behavior once all spare area filled up.
I recorded instantaneous IOPS every second for the duration of the test. I then plotted IOPS vs. time and generated the scatter plots below. Each set of graphs features the same scale. The first two sets use a log scale for easy comparison, while the last set of graphs uses a linear scale that tops out at 40K IOPS for better visualization of differences between drives.
The first set of graphs shows the performance data over the entire 2000 second test period. In these charts you'll notice an early period of very high performance followed by a sharp dropoff. What you're seeing in that case is the drive alllocating new blocks from its spare area, then eventually using up all free blocks and having to perform a read-modify-write for all subsequent writes (write amplification goes up, performance goes down).
The second set of graphs zooms in to the beginning of steady state operation for the drive (t=1400s). The third set also looks at the beginning of steady state operation but on a linear performance scale. Click the buttons below each graph to switch source data.
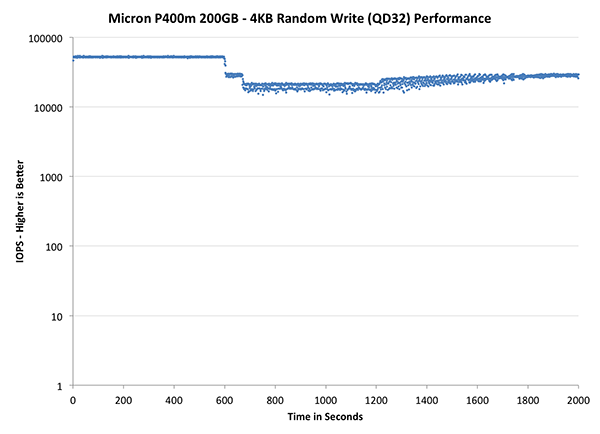
At a high level, the P400m actually looks really good. Thanks to tons of spare area on the drive by default, performance until the 600 second marker is incredibly consistent. After that point things get a bit more erratic but compared to the P400e this drive is in a completely different league of performance consistency. Intel's S3700 is a bit better here, but the P400m is a clear step in the right direction.
The next set of charts look at the steady state (for most drives) portion of the curve. Here we'll get some better visibility into how everyone will perform over the long run.
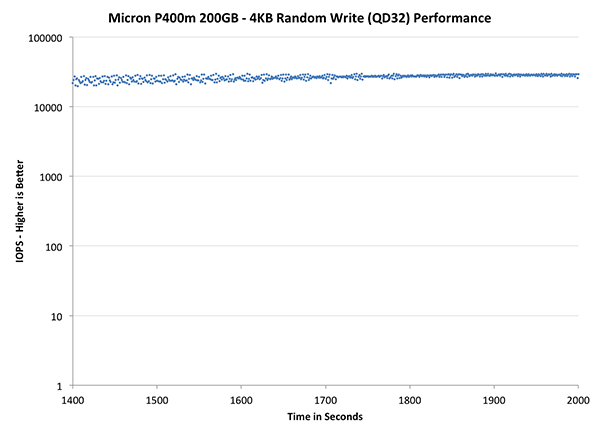
Looking closer we see a clear improvement in consistency over the P400e. The P400m is truly an upgrade for customers who have write heavy workloads (e.g. high traffic database servers).
The final set of graphs abandons the log scale entirely and just looks at a linear scale that tops out at 40K IOPS. We're also only looking at steady state (or close to it) performance here:
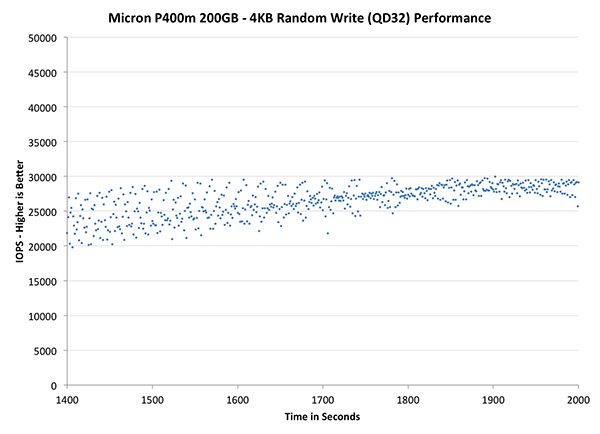
It's interesting that consistency seems to improve over time after falling behind a bit. We really hit the worst inconsistency early on here, and even then it's no where near as bad as on the P400e. Intel's S3700 maintains a tighter distribution of IOPS however.


23 Comments
View All Comments
JarredWalton - Wednesday, February 13, 2013 - link
I'm not sure what causes it, but periodically when an article posts the Like button is broken and basically "maxes out". I don't know where the 1394 number comes from (not FireWire! Hahaha), but I'll pass the info to John, our web guy, to see if he can do something about it. It was supposed to be fixed....Beenthere - Wednesday, February 13, 2013 - link
Tell that to those with the "100 hour crash" syndrome...All of the SSD makers have been rushing half-baked products to market for huge profits from gullible consumers duped by the media. With Smasungs SSD and now PC issues, it's pretty safe to conclude that quite a few of the brand name SSD suppliers are cashing in on half-baked crap.
Death666Angel - Wednesday, February 13, 2013 - link
Was he saying that they never have issues with their SSDs? No, that's what the "more" indicates (more stable than competition, not absolutely, 100% stable all the time).And just because there are issues doesn't mean things are half baked, in my opinion. Everything can have issues, even centuries old technology or stuff they through countless man-hours and money at. I personally owned 3 SSDs (Agility, Vertex2, 840 non-Pro), all working fine to this day. I owned a Samsung laptop, smartphone, tablet, all fine. Am I saying that everything with them is fine? No. But there is no point in being a doom-sayer like you at the moment either.
Mr Perfect - Wednesday, February 13, 2013 - link
Don't mind him, he posts something similar in every SSD related article regardless of make or model.Death666Angel - Wednesday, February 13, 2013 - link
Thanks I'll note his name for ignoring in the future :P.JellyRoll - Wednesday, February 13, 2013 - link
The whole thing looks great (with the exception of Anand making some very major flaws listing the design of the unit) until the very end where he essentially says, "buy intel", even though they have nowhere near the features of the P5400m. I am wondering how he came to that conclusion.melgross - Wednesday, February 13, 2013 - link
I don't recall him saying that. He mentioned price performance. This performs somewhat worse than the Intel drive, so he said that if it were less expensive, it would be worth looking at, but that if it were more expensive, then the Intel drive would be a better bet. Since micron's pricing is pretty high, as given, though they told him the pricing was wrong, we don't know the pricing.I think his closing remarks were right on the money, so to speak.
Are you sure you understood what he said?
Mr Perfect - Wednesday, February 13, 2013 - link
I'm assuming that the endurance rating "DW" is referring to drive-writes a day? Meaning "10DW x 5 years" is ten complete drive writes a day for five years?Anand Lal Shimpi - Wednesday, February 13, 2013 - link
Correct, I will clarify in the table.Take care,
Anand
zeadlots - Wednesday, February 13, 2013 - link
Is it just me or do the graphs on the second page feature the Samsung 840pro SSD, but the subsequent graphs all have the Samsung SM825. It was my understanding that the 840pro was top 3 on most tests according to another article of yours. Hoping someone can doublecheck this.